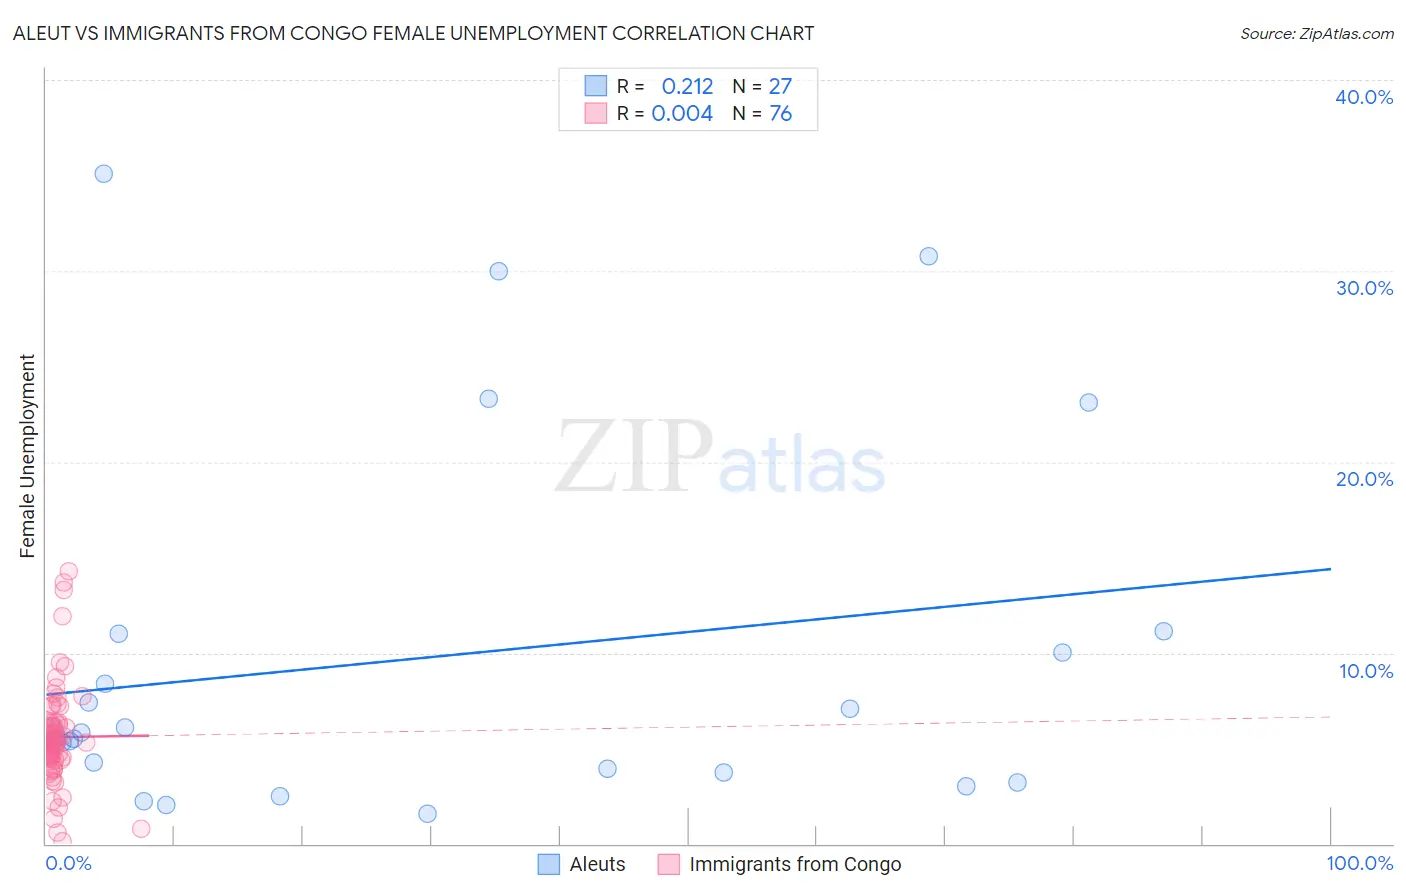
Aleut vs Immigrants from Congo Female Unemployment
COMPARE
Aleut
Immigrants from Congo
Female Unemployment
Female Unemployment Comparison
Aleuts
Immigrants from Congo
5.5%
FEMALE UNEMPLOYMENT
3.0/ 100
METRIC RATING
239th/ 347
METRIC RANK
5.3%
FEMALE UNEMPLOYMENT
43.1/ 100
METRIC RATING
180th/ 347
METRIC RANK
Aleut vs Immigrants from Congo Female Unemployment Correlation Chart
The statistical analysis conducted on geographies consisting of 61,655,077 people shows a weak positive correlation between the proportion of Aleuts and unemploymnet rate among females in the United States with a correlation coefficient (R) of 0.212 and weighted average of 5.5%. Similarly, the statistical analysis conducted on geographies consisting of 92,074,429 people shows no correlation between the proportion of Immigrants from Congo and unemploymnet rate among females in the United States with a correlation coefficient (R) of 0.004 and weighted average of 5.3%, a difference of 4.8%.
Female Unemployment Correlation Summary
| Measurement | Aleut | Immigrants from Congo |
| Minimum | 1.6% | 0.10% |
| Maximum | 35.1% | 14.3% |
| Range | 33.5% | 14.2% |
| Mean | 9.7% | 5.6% |
| Median | 5.7% | 5.3% |
| Interquartile 25% (IQ1) | 3.7% | 4.5% |
| Interquartile 75% (IQ3) | 11.0% | 6.2% |
| Interquartile Range (IQR) | 7.3% | 1.7% |
| Standard Deviation (Sample) | 9.7% | 2.6% |
| Standard Deviation (Population) | 9.5% | 2.5% |
Similar Demographics by Female Unemployment
Demographics Similar to Aleuts by Female Unemployment
In terms of female unemployment, the demographic groups most similar to Aleuts are Immigrants from South America (5.5%, a difference of 0.040%), South American Indian (5.5%, a difference of 0.080%), Sierra Leonean (5.5%, a difference of 0.10%), Immigrants from Panama (5.5%, a difference of 0.12%), and Immigrants from Cambodia (5.5%, a difference of 0.14%).
| Demographics | Rating | Rank | Female Unemployment |
| Liberians | 3.9 /100 | #232 | Tragic 5.5% |
| Moroccans | 3.4 /100 | #233 | Tragic 5.5% |
| Immigrants | Lebanon | 3.3 /100 | #234 | Tragic 5.5% |
| Immigrants | Iran | 3.3 /100 | #235 | Tragic 5.5% |
| Immigrants | Cambodia | 3.3 /100 | #236 | Tragic 5.5% |
| Immigrants | Panama | 3.2 /100 | #237 | Tragic 5.5% |
| Sierra Leoneans | 3.2 /100 | #238 | Tragic 5.5% |
| Aleuts | 3.0 /100 | #239 | Tragic 5.5% |
| Immigrants | South America | 2.9 /100 | #240 | Tragic 5.5% |
| South American Indians | 2.8 /100 | #241 | Tragic 5.5% |
| Marshallese | 2.3 /100 | #242 | Tragic 5.6% |
| Spanish Americans | 2.2 /100 | #243 | Tragic 5.6% |
| Immigrants | Liberia | 1.5 /100 | #244 | Tragic 5.6% |
| Guamanians/Chamorros | 1.4 /100 | #245 | Tragic 5.6% |
| Japanese | 1.2 /100 | #246 | Tragic 5.6% |
Demographics Similar to Immigrants from Congo by Female Unemployment
In terms of female unemployment, the demographic groups most similar to Immigrants from Congo are Taiwanese (5.3%, a difference of 0.020%), Nonimmigrants (5.3%, a difference of 0.030%), Laotian (5.3%, a difference of 0.12%), Immigrants from Indonesia (5.3%, a difference of 0.15%), and Immigrants from Ukraine (5.3%, a difference of 0.18%).
| Demographics | Rating | Rank | Female Unemployment |
| Iranians | 50.4 /100 | #173 | Average 5.3% |
| Immigrants | Poland | 50.0 /100 | #174 | Average 5.3% |
| Immigrants | Laos | 47.5 /100 | #175 | Average 5.3% |
| Immigrants | Vietnam | 47.5 /100 | #176 | Average 5.3% |
| Immigrants | Morocco | 47.4 /100 | #177 | Average 5.3% |
| Immigrants | Southern Europe | 46.2 /100 | #178 | Average 5.3% |
| Laotians | 45.1 /100 | #179 | Average 5.3% |
| Immigrants | Congo | 43.1 /100 | #180 | Average 5.3% |
| Taiwanese | 42.7 /100 | #181 | Average 5.3% |
| Immigrants | Nonimmigrants | 42.6 /100 | #182 | Average 5.3% |
| Immigrants | Indonesia | 40.7 /100 | #183 | Average 5.3% |
| Immigrants | Ukraine | 40.1 /100 | #184 | Average 5.3% |
| Malaysians | 40.1 /100 | #185 | Average 5.3% |
| Immigrants | Belarus | 39.4 /100 | #186 | Fair 5.3% |
| Immigrants | Albania | 35.4 /100 | #187 | Fair 5.3% |