Aleut vs Guatemalan Single Mother Poverty
COMPARE
Aleut
Guatemalan
Single Mother Poverty
Single Mother Poverty Comparison
Aleuts
Guatemalans
32.9%
SINGLE MOTHER POVERTY
0.0/ 100
METRIC RATING
293rd/ 347
METRIC RANK
32.9%
SINGLE MOTHER POVERTY
0.0/ 100
METRIC RATING
291st/ 347
METRIC RANK
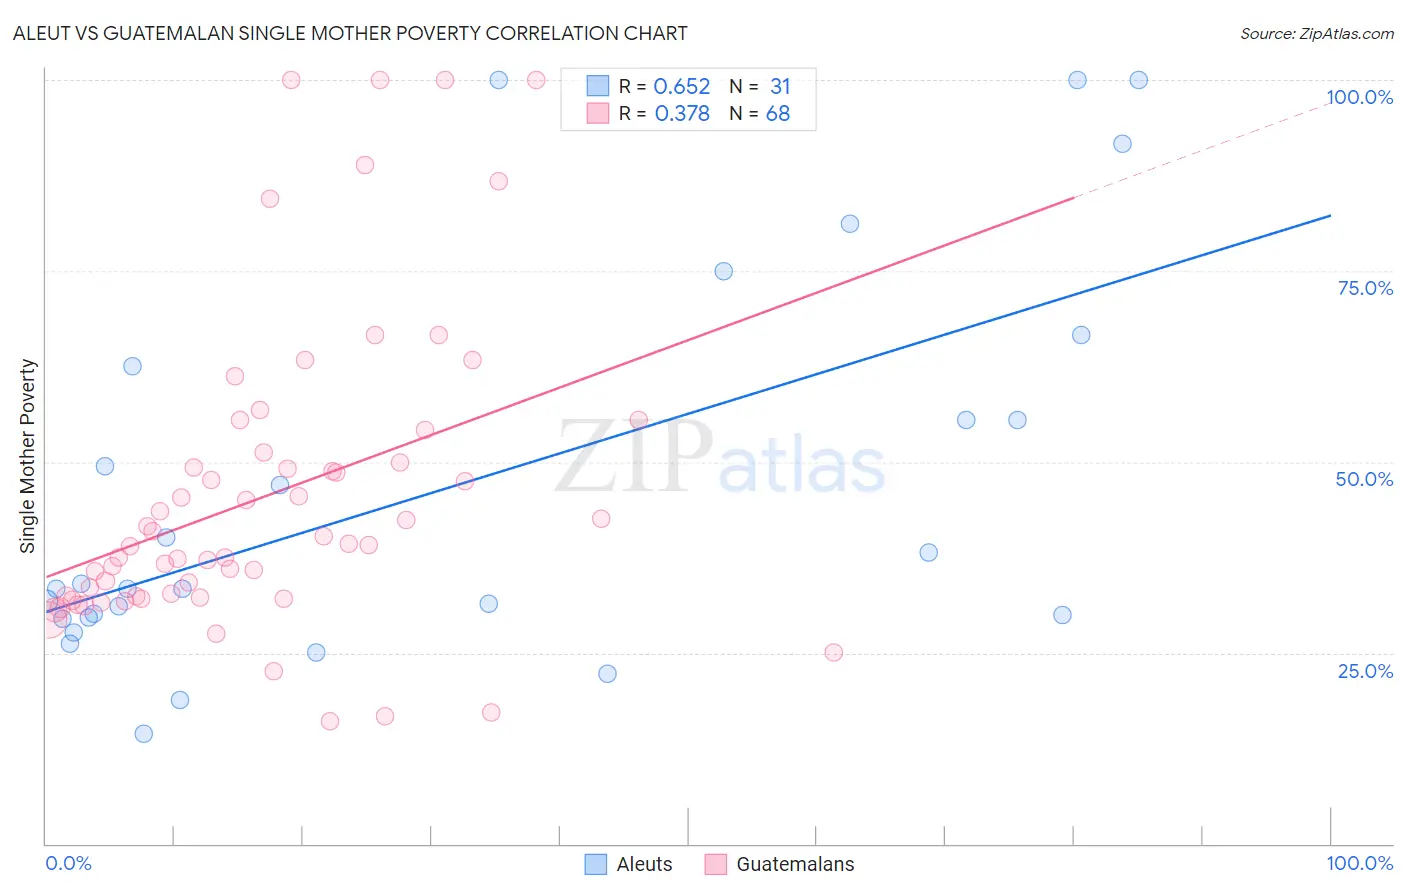
Aleut vs Guatemalan Single Mother Poverty Correlation Chart
The statistical analysis conducted on geographies consisting of 61,416,159 people shows a significant positive correlation between the proportion of Aleuts and poverty level among single mothers in the United States with a correlation coefficient (R) of 0.652 and weighted average of 32.9%. Similarly, the statistical analysis conducted on geographies consisting of 401,916,262 people shows a mild positive correlation between the proportion of Guatemalans and poverty level among single mothers in the United States with a correlation coefficient (R) of 0.378 and weighted average of 32.9%, a difference of 0.050%.
Single Mother Poverty Correlation Summary
| Measurement | Aleut | Guatemalan |
| Minimum | 14.4% | 16.0% |
| Maximum | 100.0% | 100.0% |
| Range | 85.6% | 84.0% |
| Mean | 46.6% | 45.6% |
| Median | 33.4% | 39.2% |
| Interquartile 25% (IQ1) | 29.6% | 32.3% |
| Interquartile 75% (IQ3) | 62.5% | 50.6% |
| Interquartile Range (IQR) | 32.9% | 18.3% |
| Standard Deviation (Sample) | 25.6% | 20.1% |
| Standard Deviation (Population) | 25.2% | 19.9% |
Demographics Similar to Aleuts and Guatemalans by Single Mother Poverty
In terms of single mother poverty, the demographic groups most similar to Aleuts are Shoshone (32.9%, a difference of 0.030%), French American Indian (33.1%, a difference of 0.63%), Yaqui (33.1%, a difference of 0.66%), Blackfeet (33.2%, a difference of 0.82%), and Osage (32.6%, a difference of 0.95%). Similarly, the demographic groups most similar to Guatemalans are Shoshone (32.9%, a difference of 0.020%), French American Indian (33.1%, a difference of 0.68%), Yaqui (33.1%, a difference of 0.72%), Blackfeet (33.2%, a difference of 0.88%), and Osage (32.6%, a difference of 0.90%).
| Demographics | Rating | Rank | Single Mother Poverty |
| Immigrants | Azores | 0.0 /100 | #282 | Tragic 32.2% |
| Spanish Americans | 0.0 /100 | #283 | Tragic 32.3% |
| Indonesians | 0.0 /100 | #284 | Tragic 32.4% |
| Immigrants | Latin America | 0.0 /100 | #285 | Tragic 32.4% |
| Yup'ik | 0.0 /100 | #286 | Tragic 32.5% |
| Immigrants | Dominica | 0.0 /100 | #287 | Tragic 32.5% |
| Somalis | 0.0 /100 | #288 | Tragic 32.6% |
| U.S. Virgin Islanders | 0.0 /100 | #289 | Tragic 32.6% |
| Osage | 0.0 /100 | #290 | Tragic 32.6% |
| Guatemalans | 0.0 /100 | #291 | Tragic 32.9% |
| Shoshone | 0.0 /100 | #292 | Tragic 32.9% |
| Aleuts | 0.0 /100 | #293 | Tragic 32.9% |
| French American Indians | 0.0 /100 | #294 | Tragic 33.1% |
| Yaqui | 0.0 /100 | #295 | Tragic 33.1% |
| Blackfeet | 0.0 /100 | #296 | Tragic 33.2% |
| Pennsylvania Germans | 0.0 /100 | #297 | Tragic 33.2% |
| Africans | 0.0 /100 | #298 | Tragic 33.3% |
| Immigrants | Guatemala | 0.0 /100 | #299 | Tragic 33.3% |
| Hispanics or Latinos | 0.0 /100 | #300 | Tragic 33.3% |
| Immigrants | Somalia | 0.0 /100 | #301 | Tragic 33.4% |
| Arapaho | 0.0 /100 | #302 | Tragic 33.4% |