Alaskan Athabascan vs Bolivian Male Poverty
COMPARE
Alaskan Athabascan
Bolivian
Male Poverty
Male Poverty Comparison
Alaskan Athabascans
Bolivians
12.8%
MALE POVERTY
0.3/ 100
METRIC RATING
243rd/ 347
METRIC RANK
9.4%
MALE POVERTY
99.9/ 100
METRIC RATING
11th/ 347
METRIC RANK
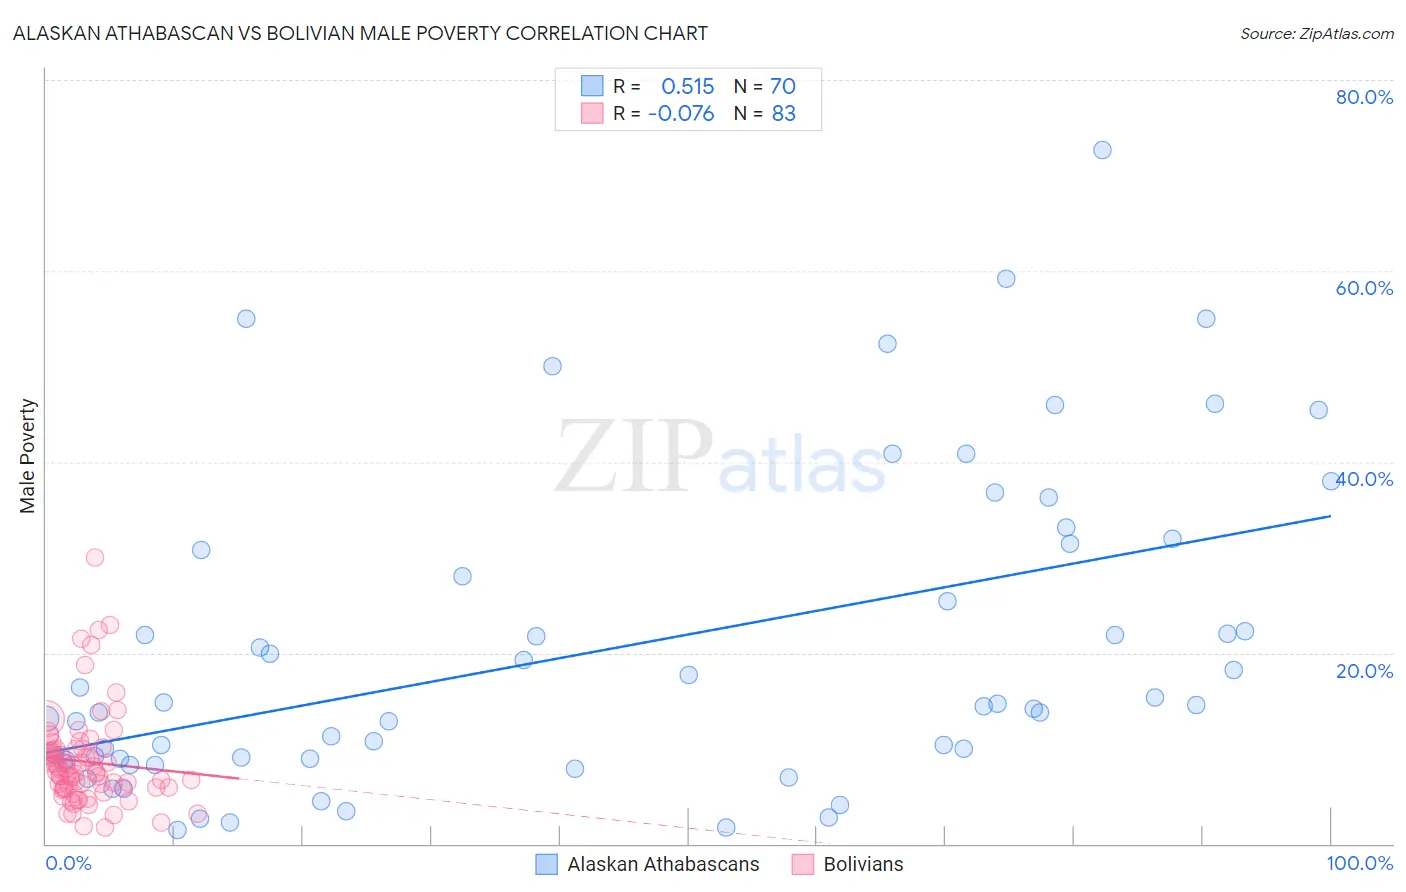
Alaskan Athabascan vs Bolivian Male Poverty Correlation Chart
The statistical analysis conducted on geographies consisting of 45,812,962 people shows a substantial positive correlation between the proportion of Alaskan Athabascans and poverty level among males in the United States with a correlation coefficient (R) of 0.515 and weighted average of 12.8%. Similarly, the statistical analysis conducted on geographies consisting of 184,589,682 people shows a slight negative correlation between the proportion of Bolivians and poverty level among males in the United States with a correlation coefficient (R) of -0.076 and weighted average of 9.4%, a difference of 36.3%.
Male Poverty Correlation Summary
| Measurement | Alaskan Athabascan | Bolivian |
| Minimum | 1.4% | 1.7% |
| Maximum | 72.7% | 29.9% |
| Range | 71.3% | 28.3% |
| Mean | 20.4% | 8.6% |
| Median | 14.5% | 7.5% |
| Interquartile 25% (IQ1) | 8.9% | 5.9% |
| Interquartile 75% (IQ3) | 30.8% | 9.9% |
| Interquartile Range (IQR) | 22.0% | 4.0% |
| Standard Deviation (Sample) | 16.4% | 4.9% |
| Standard Deviation (Population) | 16.2% | 4.9% |
Similar Demographics by Male Poverty
Demographics Similar to Alaskan Athabascans by Male Poverty
In terms of male poverty, the demographic groups most similar to Alaskan Athabascans are Nepalese (12.8%, a difference of 0.040%), Tsimshian (12.8%, a difference of 0.11%), Liberian (12.8%, a difference of 0.12%), Sudanese (12.8%, a difference of 0.20%), and Immigrants from El Salvador (12.8%, a difference of 0.42%).
| Demographics | Rating | Rank | Male Poverty |
| Immigrants | Saudi Arabia | 0.4 /100 | #236 | Tragic 12.7% |
| French American Indians | 0.4 /100 | #237 | Tragic 12.7% |
| Ecuadorians | 0.4 /100 | #238 | Tragic 12.7% |
| Ghanaians | 0.4 /100 | #239 | Tragic 12.7% |
| Immigrants | Middle Africa | 0.4 /100 | #240 | Tragic 12.7% |
| Sudanese | 0.3 /100 | #241 | Tragic 12.8% |
| Nepalese | 0.3 /100 | #242 | Tragic 12.8% |
| Alaskan Athabascans | 0.3 /100 | #243 | Tragic 12.8% |
| Tsimshian | 0.3 /100 | #244 | Tragic 12.8% |
| Liberians | 0.3 /100 | #245 | Tragic 12.8% |
| Immigrants | El Salvador | 0.2 /100 | #246 | Tragic 12.8% |
| Immigrants | Western Africa | 0.2 /100 | #247 | Tragic 12.9% |
| Immigrants | Sudan | 0.2 /100 | #248 | Tragic 12.9% |
| Potawatomi | 0.2 /100 | #249 | Tragic 12.9% |
| Immigrants | Nicaragua | 0.2 /100 | #250 | Tragic 12.9% |
Demographics Similar to Bolivians by Male Poverty
In terms of male poverty, the demographic groups most similar to Bolivians are Immigrants from Bolivia (9.4%, a difference of 0.050%), Immigrants from Lithuania (9.4%, a difference of 0.17%), Immigrants from North Macedonia (9.4%, a difference of 0.56%), Bulgarian (9.3%, a difference of 0.64%), and Bhutanese (9.5%, a difference of 0.85%).
| Demographics | Rating | Rank | Male Poverty |
| Immigrants | Taiwan | 100.0 /100 | #4 | Exceptional 8.9% |
| Maltese | 100.0 /100 | #5 | Exceptional 9.1% |
| Assyrians/Chaldeans/Syriacs | 99.9 /100 | #6 | Exceptional 9.1% |
| Immigrants | Ireland | 99.9 /100 | #7 | Exceptional 9.1% |
| Filipinos | 99.9 /100 | #8 | Exceptional 9.2% |
| Immigrants | South Central Asia | 99.9 /100 | #9 | Exceptional 9.3% |
| Bulgarians | 99.9 /100 | #10 | Exceptional 9.3% |
| Bolivians | 99.9 /100 | #11 | Exceptional 9.4% |
| Immigrants | Bolivia | 99.9 /100 | #12 | Exceptional 9.4% |
| Immigrants | Lithuania | 99.9 /100 | #13 | Exceptional 9.4% |
| Immigrants | North Macedonia | 99.8 /100 | #14 | Exceptional 9.4% |
| Bhutanese | 99.8 /100 | #15 | Exceptional 9.5% |
| Luxembourgers | 99.8 /100 | #16 | Exceptional 9.5% |
| Norwegians | 99.8 /100 | #17 | Exceptional 9.5% |
| Lithuanians | 99.8 /100 | #18 | Exceptional 9.5% |