Chilean vs Immigrants from Eastern Asia Male Poverty
COMPARE
Chilean
Immigrants from Eastern Asia
Male Poverty
Male Poverty Comparison
Chileans
Immigrants from Eastern Asia
10.7%
MALE POVERTY
83.9/ 100
METRIC RATING
130th/ 347
METRIC RANK
10.4%
MALE POVERTY
95.3/ 100
METRIC RATING
86th/ 347
METRIC RANK
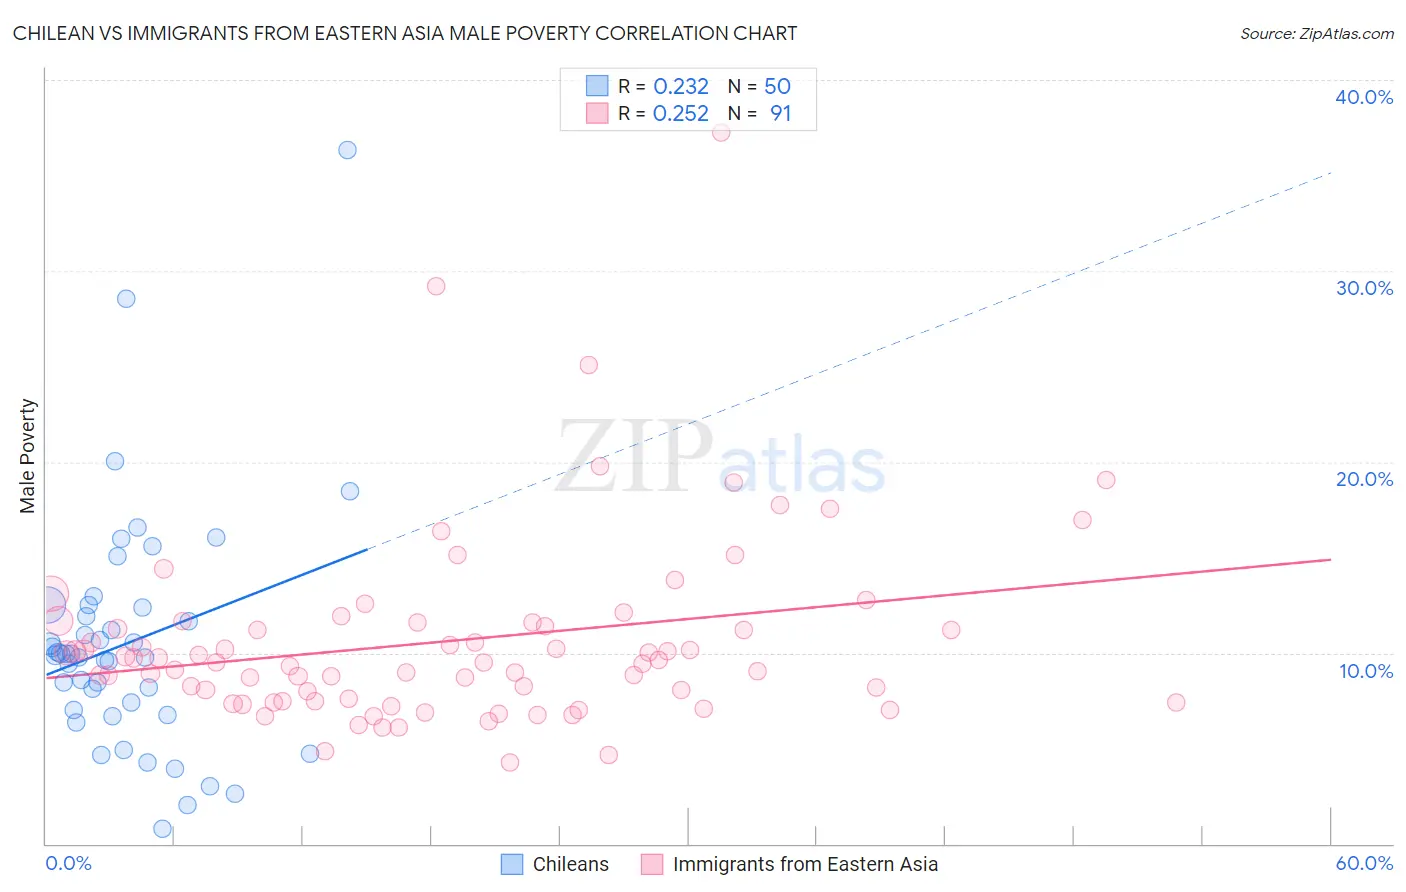
Chilean vs Immigrants from Eastern Asia Male Poverty Correlation Chart
The statistical analysis conducted on geographies consisting of 256,512,426 people shows a weak positive correlation between the proportion of Chileans and poverty level among males in the United States with a correlation coefficient (R) of 0.232 and weighted average of 10.7%. Similarly, the statistical analysis conducted on geographies consisting of 498,983,535 people shows a weak positive correlation between the proportion of Immigrants from Eastern Asia and poverty level among males in the United States with a correlation coefficient (R) of 0.252 and weighted average of 10.4%, a difference of 3.6%.
Male Poverty Correlation Summary
| Measurement | Chilean | Immigrants from Eastern Asia |
| Minimum | 0.80% | 4.2% |
| Maximum | 36.4% | 37.3% |
| Range | 35.6% | 33.0% |
| Mean | 10.5% | 10.6% |
| Median | 9.9% | 9.5% |
| Interquartile 25% (IQ1) | 7.0% | 7.5% |
| Interquartile 75% (IQ3) | 12.4% | 11.6% |
| Interquartile Range (IQR) | 5.3% | 4.1% |
| Standard Deviation (Sample) | 6.2% | 5.0% |
| Standard Deviation (Population) | 6.1% | 5.0% |
Similar Demographics by Male Poverty
Demographics Similar to Chileans by Male Poverty
In terms of male poverty, the demographic groups most similar to Chileans are Immigrants from Peru (10.7%, a difference of 0.050%), Immigrants from Western Europe (10.7%, a difference of 0.060%), Puget Sound Salish (10.7%, a difference of 0.070%), Immigrants from Ukraine (10.7%, a difference of 0.080%), and Immigrants from Belarus (10.7%, a difference of 0.11%).
| Demographics | Rating | Rank | Male Poverty |
| South Africans | 86.8 /100 | #123 | Excellent 10.7% |
| French | 86.7 /100 | #124 | Excellent 10.7% |
| Immigrants | Norway | 86.0 /100 | #125 | Excellent 10.7% |
| Immigrants | Ukraine | 84.3 /100 | #126 | Excellent 10.7% |
| Puget Sound Salish | 84.3 /100 | #127 | Excellent 10.7% |
| Immigrants | Western Europe | 84.2 /100 | #128 | Excellent 10.7% |
| Immigrants | Peru | 84.1 /100 | #129 | Excellent 10.7% |
| Chileans | 83.9 /100 | #130 | Excellent 10.7% |
| Immigrants | Belarus | 83.3 /100 | #131 | Excellent 10.7% |
| Immigrants | Vietnam | 83.0 /100 | #132 | Excellent 10.8% |
| Pakistanis | 83.0 /100 | #133 | Excellent 10.8% |
| New Zealanders | 82.9 /100 | #134 | Excellent 10.8% |
| Brazilians | 82.7 /100 | #135 | Excellent 10.8% |
| Immigrants | Israel | 80.9 /100 | #136 | Excellent 10.8% |
| Immigrants | Switzerland | 79.2 /100 | #137 | Good 10.8% |
Demographics Similar to Immigrants from Eastern Asia by Male Poverty
In terms of male poverty, the demographic groups most similar to Immigrants from Eastern Asia are Northern European (10.4%, a difference of 0.040%), Immigrants from England (10.4%, a difference of 0.13%), Czechoslovakian (10.3%, a difference of 0.18%), Cambodian (10.4%, a difference of 0.18%), and Immigrants from Denmark (10.4%, a difference of 0.18%).
| Demographics | Rating | Rank | Male Poverty |
| Immigrants | North America | 96.5 /100 | #79 | Exceptional 10.3% |
| English | 96.4 /100 | #80 | Exceptional 10.3% |
| Belgians | 95.9 /100 | #81 | Exceptional 10.3% |
| Egyptians | 95.9 /100 | #82 | Exceptional 10.3% |
| Immigrants | Sweden | 95.7 /100 | #83 | Exceptional 10.3% |
| Czechoslovakians | 95.6 /100 | #84 | Exceptional 10.3% |
| Immigrants | England | 95.5 /100 | #85 | Exceptional 10.4% |
| Immigrants | Eastern Asia | 95.3 /100 | #86 | Exceptional 10.4% |
| Northern Europeans | 95.2 /100 | #87 | Exceptional 10.4% |
| Cambodians | 95.0 /100 | #88 | Exceptional 10.4% |
| Immigrants | Denmark | 95.0 /100 | #89 | Exceptional 10.4% |
| Indians (Asian) | 94.9 /100 | #90 | Exceptional 10.4% |
| British | 94.8 /100 | #91 | Exceptional 10.4% |
| Jordanians | 94.4 /100 | #92 | Exceptional 10.4% |
| Australians | 94.4 /100 | #93 | Exceptional 10.4% |