Belizean vs Immigrants from Eastern Asia Male Poverty
COMPARE
Belizean
Immigrants from Eastern Asia
Male Poverty
Male Poverty Comparison
Belizeans
Immigrants from Eastern Asia
13.6%
MALE POVERTY
0.0/ 100
METRIC RATING
278th/ 347
METRIC RANK
10.4%
MALE POVERTY
95.3/ 100
METRIC RATING
86th/ 347
METRIC RANK
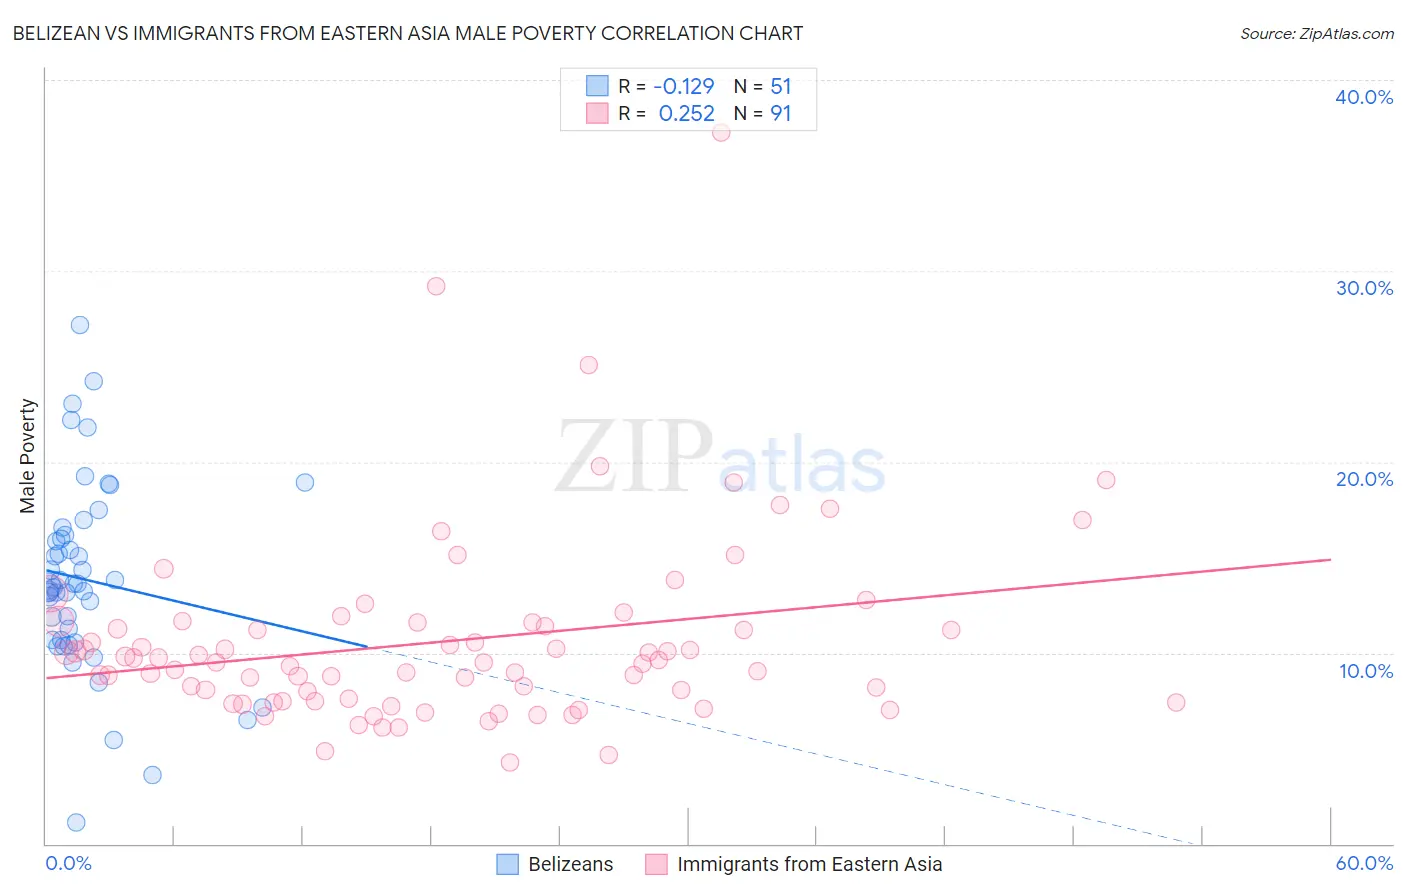
Belizean vs Immigrants from Eastern Asia Male Poverty Correlation Chart
The statistical analysis conducted on geographies consisting of 144,147,961 people shows a poor negative correlation between the proportion of Belizeans and poverty level among males in the United States with a correlation coefficient (R) of -0.129 and weighted average of 13.6%. Similarly, the statistical analysis conducted on geographies consisting of 498,983,535 people shows a weak positive correlation between the proportion of Immigrants from Eastern Asia and poverty level among males in the United States with a correlation coefficient (R) of 0.252 and weighted average of 10.4%, a difference of 31.6%.
Male Poverty Correlation Summary
| Measurement | Belizean | Immigrants from Eastern Asia |
| Minimum | 1.1% | 4.2% |
| Maximum | 27.1% | 37.3% |
| Range | 26.0% | 33.0% |
| Mean | 13.8% | 10.6% |
| Median | 13.5% | 9.5% |
| Interquartile 25% (IQ1) | 10.7% | 7.5% |
| Interquartile 75% (IQ3) | 16.2% | 11.6% |
| Interquartile Range (IQR) | 5.5% | 4.1% |
| Standard Deviation (Sample) | 5.0% | 5.0% |
| Standard Deviation (Population) | 4.9% | 5.0% |
Similar Demographics by Male Poverty
Demographics Similar to Belizeans by Male Poverty
In terms of male poverty, the demographic groups most similar to Belizeans are Bangladeshi (13.6%, a difference of 0.10%), Haitian (13.7%, a difference of 0.18%), Immigrants from Latin America (13.6%, a difference of 0.24%), Mexican (13.7%, a difference of 0.27%), and Yaqui (13.7%, a difference of 0.32%).
| Demographics | Rating | Rank | Male Poverty |
| Spanish Americans | 0.0 /100 | #271 | Tragic 13.4% |
| Immigrants | Bahamas | 0.0 /100 | #272 | Tragic 13.5% |
| Chickasaw | 0.0 /100 | #273 | Tragic 13.5% |
| Immigrants | West Indies | 0.0 /100 | #274 | Tragic 13.5% |
| Barbadians | 0.0 /100 | #275 | Tragic 13.6% |
| Immigrants | Latin America | 0.0 /100 | #276 | Tragic 13.6% |
| Bangladeshis | 0.0 /100 | #277 | Tragic 13.6% |
| Belizeans | 0.0 /100 | #278 | Tragic 13.6% |
| Haitians | 0.0 /100 | #279 | Tragic 13.7% |
| Mexicans | 0.0 /100 | #280 | Tragic 13.7% |
| Yaqui | 0.0 /100 | #281 | Tragic 13.7% |
| Immigrants | Cabo Verde | 0.0 /100 | #282 | Tragic 13.7% |
| Comanche | 0.0 /100 | #283 | Tragic 13.8% |
| Immigrants | Haiti | 0.0 /100 | #284 | Tragic 13.8% |
| West Indians | 0.0 /100 | #285 | Tragic 13.8% |
Demographics Similar to Immigrants from Eastern Asia by Male Poverty
In terms of male poverty, the demographic groups most similar to Immigrants from Eastern Asia are Northern European (10.4%, a difference of 0.040%), Immigrants from England (10.4%, a difference of 0.13%), Czechoslovakian (10.3%, a difference of 0.18%), Cambodian (10.4%, a difference of 0.18%), and Immigrants from Denmark (10.4%, a difference of 0.18%).
| Demographics | Rating | Rank | Male Poverty |
| Immigrants | North America | 96.5 /100 | #79 | Exceptional 10.3% |
| English | 96.4 /100 | #80 | Exceptional 10.3% |
| Belgians | 95.9 /100 | #81 | Exceptional 10.3% |
| Egyptians | 95.9 /100 | #82 | Exceptional 10.3% |
| Immigrants | Sweden | 95.7 /100 | #83 | Exceptional 10.3% |
| Czechoslovakians | 95.6 /100 | #84 | Exceptional 10.3% |
| Immigrants | England | 95.5 /100 | #85 | Exceptional 10.4% |
| Immigrants | Eastern Asia | 95.3 /100 | #86 | Exceptional 10.4% |
| Northern Europeans | 95.2 /100 | #87 | Exceptional 10.4% |
| Cambodians | 95.0 /100 | #88 | Exceptional 10.4% |
| Immigrants | Denmark | 95.0 /100 | #89 | Exceptional 10.4% |
| Indians (Asian) | 94.9 /100 | #90 | Exceptional 10.4% |
| British | 94.8 /100 | #91 | Exceptional 10.4% |
| Jordanians | 94.4 /100 | #92 | Exceptional 10.4% |
| Australians | 94.4 /100 | #93 | Exceptional 10.4% |