Cuban vs Immigrants from Eastern Asia Male Poverty
COMPARE
Cuban
Immigrants from Eastern Asia
Male Poverty
Male Poverty Comparison
Cubans
Immigrants from Eastern Asia
12.4%
MALE POVERTY
1.3/ 100
METRIC RATING
229th/ 347
METRIC RANK
10.4%
MALE POVERTY
95.3/ 100
METRIC RATING
86th/ 347
METRIC RANK
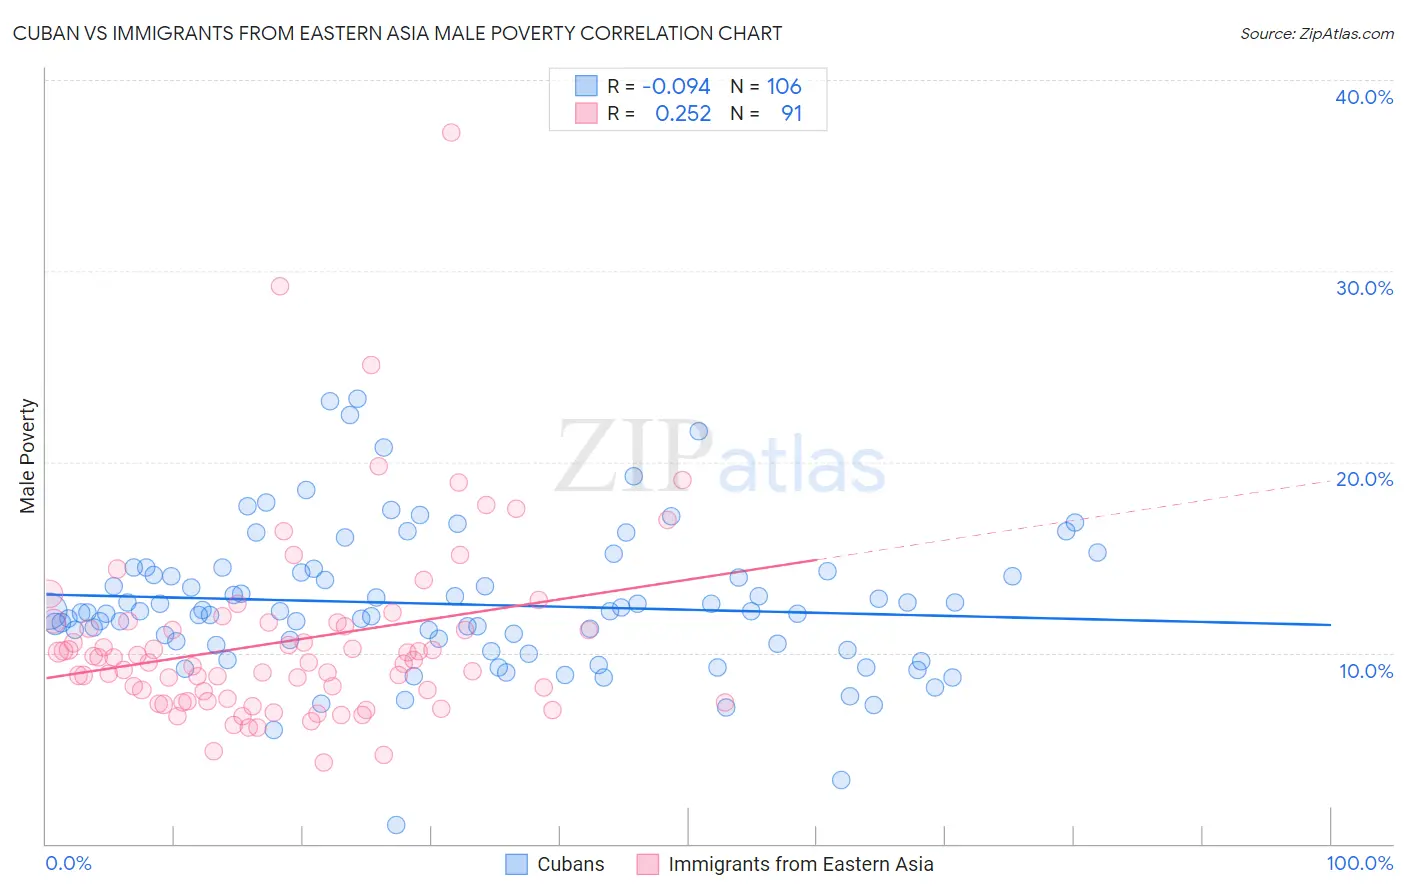
Cuban vs Immigrants from Eastern Asia Male Poverty Correlation Chart
The statistical analysis conducted on geographies consisting of 448,765,698 people shows a slight negative correlation between the proportion of Cubans and poverty level among males in the United States with a correlation coefficient (R) of -0.094 and weighted average of 12.4%. Similarly, the statistical analysis conducted on geographies consisting of 498,983,535 people shows a weak positive correlation between the proportion of Immigrants from Eastern Asia and poverty level among males in the United States with a correlation coefficient (R) of 0.252 and weighted average of 10.4%, a difference of 19.4%.
Male Poverty Correlation Summary
| Measurement | Cuban | Immigrants from Eastern Asia |
| Minimum | 0.97% | 4.2% |
| Maximum | 23.3% | 37.3% |
| Range | 22.4% | 33.0% |
| Mean | 12.5% | 10.6% |
| Median | 12.2% | 9.5% |
| Interquartile 25% (IQ1) | 10.5% | 7.5% |
| Interquartile 75% (IQ3) | 14.2% | 11.6% |
| Interquartile Range (IQR) | 3.8% | 4.1% |
| Standard Deviation (Sample) | 3.7% | 5.0% |
| Standard Deviation (Population) | 3.7% | 5.0% |
Similar Demographics by Male Poverty
Demographics Similar to Cubans by Male Poverty
In terms of male poverty, the demographic groups most similar to Cubans are Alsatian (12.4%, a difference of 0.090%), Alaska Native (12.4%, a difference of 0.13%), Nigerian (12.3%, a difference of 0.23%), Osage (12.3%, a difference of 0.39%), and Immigrants from Nigeria (12.3%, a difference of 0.45%).
| Demographics | Rating | Rank | Male Poverty |
| Immigrants | Africa | 2.1 /100 | #222 | Tragic 12.2% |
| Immigrants | Micronesia | 2.1 /100 | #223 | Tragic 12.2% |
| Immigrants | Nigeria | 1.6 /100 | #224 | Tragic 12.3% |
| Osage | 1.5 /100 | #225 | Tragic 12.3% |
| Nigerians | 1.4 /100 | #226 | Tragic 12.3% |
| Alaska Natives | 1.4 /100 | #227 | Tragic 12.4% |
| Alsatians | 1.3 /100 | #228 | Tragic 12.4% |
| Cubans | 1.3 /100 | #229 | Tragic 12.4% |
| Marshallese | 0.8 /100 | #230 | Tragic 12.5% |
| Salvadorans | 0.6 /100 | #231 | Tragic 12.6% |
| Nicaraguans | 0.6 /100 | #232 | Tragic 12.6% |
| Fijians | 0.6 /100 | #233 | Tragic 12.6% |
| Immigrants | Armenia | 0.6 /100 | #234 | Tragic 12.6% |
| Immigrants | Laos | 0.5 /100 | #235 | Tragic 12.6% |
| Immigrants | Saudi Arabia | 0.4 /100 | #236 | Tragic 12.7% |
Demographics Similar to Immigrants from Eastern Asia by Male Poverty
In terms of male poverty, the demographic groups most similar to Immigrants from Eastern Asia are Northern European (10.4%, a difference of 0.040%), Immigrants from England (10.4%, a difference of 0.13%), Czechoslovakian (10.3%, a difference of 0.18%), Cambodian (10.4%, a difference of 0.18%), and Immigrants from Denmark (10.4%, a difference of 0.18%).
| Demographics | Rating | Rank | Male Poverty |
| Immigrants | North America | 96.5 /100 | #79 | Exceptional 10.3% |
| English | 96.4 /100 | #80 | Exceptional 10.3% |
| Belgians | 95.9 /100 | #81 | Exceptional 10.3% |
| Egyptians | 95.9 /100 | #82 | Exceptional 10.3% |
| Immigrants | Sweden | 95.7 /100 | #83 | Exceptional 10.3% |
| Czechoslovakians | 95.6 /100 | #84 | Exceptional 10.3% |
| Immigrants | England | 95.5 /100 | #85 | Exceptional 10.4% |
| Immigrants | Eastern Asia | 95.3 /100 | #86 | Exceptional 10.4% |
| Northern Europeans | 95.2 /100 | #87 | Exceptional 10.4% |
| Cambodians | 95.0 /100 | #88 | Exceptional 10.4% |
| Immigrants | Denmark | 95.0 /100 | #89 | Exceptional 10.4% |
| Indians (Asian) | 94.9 /100 | #90 | Exceptional 10.4% |
| British | 94.8 /100 | #91 | Exceptional 10.4% |
| Jordanians | 94.4 /100 | #92 | Exceptional 10.4% |
| Australians | 94.4 /100 | #93 | Exceptional 10.4% |