Alaska Native vs Immigrants from Guatemala Single Male Poverty
COMPARE
Alaska Native
Immigrants from Guatemala
Single Male Poverty
Single Male Poverty Comparison
Alaska Natives
Immigrants from Guatemala
15.4%
SINGLE MALE POVERTY
0.0/ 100
METRIC RATING
304th/ 347
METRIC RANK
13.8%
SINGLE MALE POVERTY
0.3/ 100
METRIC RATING
258th/ 347
METRIC RANK
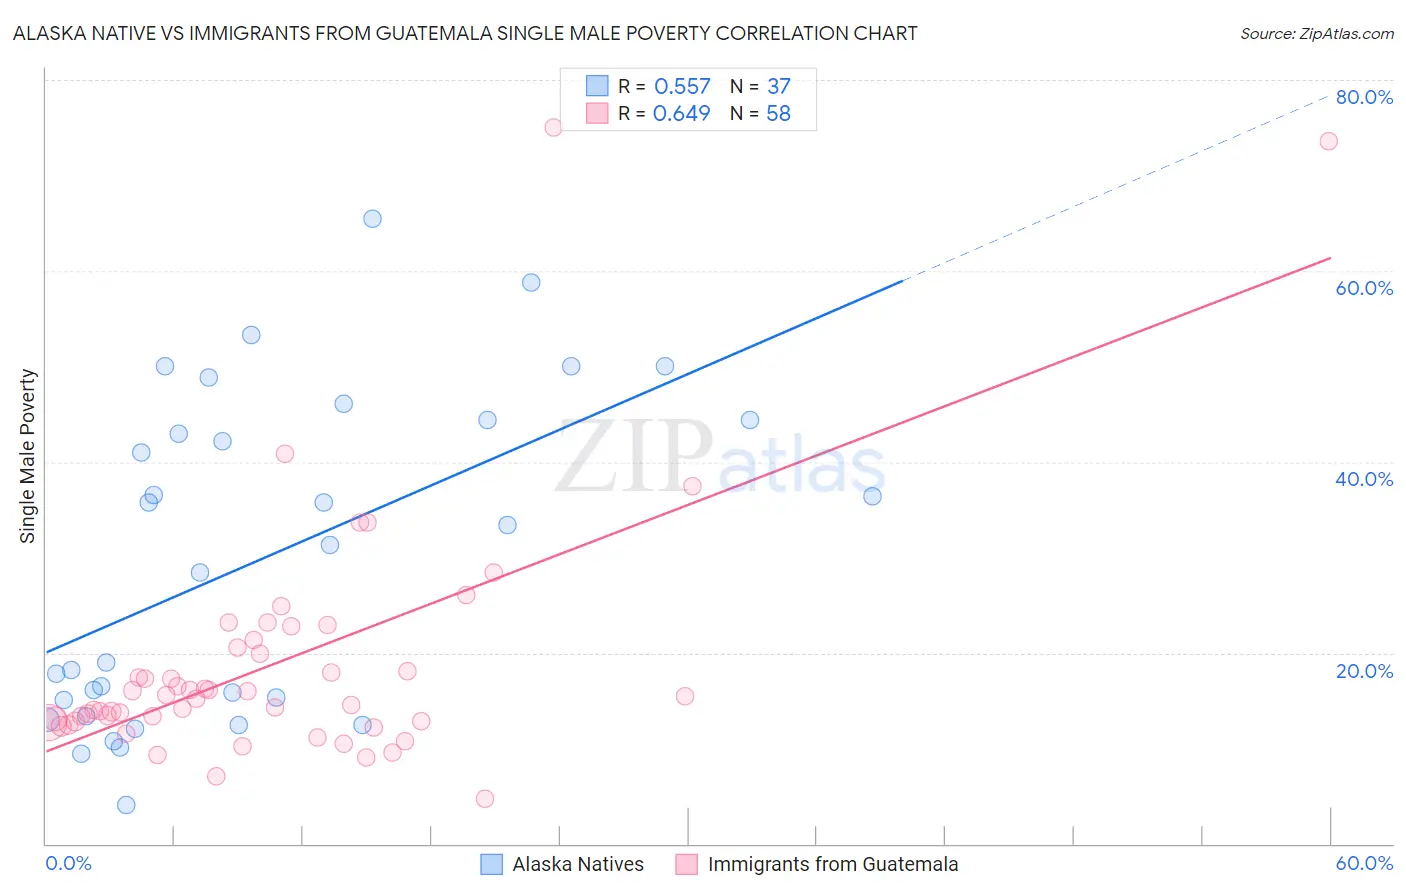
Alaska Native vs Immigrants from Guatemala Single Male Poverty Correlation Chart
The statistical analysis conducted on geographies consisting of 74,357,121 people shows a substantial positive correlation between the proportion of Alaska Natives and poverty level among single males in the United States with a correlation coefficient (R) of 0.557 and weighted average of 15.4%. Similarly, the statistical analysis conducted on geographies consisting of 342,099,721 people shows a significant positive correlation between the proportion of Immigrants from Guatemala and poverty level among single males in the United States with a correlation coefficient (R) of 0.649 and weighted average of 13.8%, a difference of 12.0%.
Single Male Poverty Correlation Summary
| Measurement | Alaska Native | Immigrants from Guatemala |
| Minimum | 4.0% | 4.7% |
| Maximum | 65.5% | 75.0% |
| Range | 61.5% | 70.3% |
| Mean | 29.9% | 18.8% |
| Median | 31.2% | 15.3% |
| Interquartile 25% (IQ1) | 14.2% | 12.8% |
| Interquartile 75% (IQ3) | 44.4% | 20.6% |
| Interquartile Range (IQR) | 30.2% | 7.8% |
| Standard Deviation (Sample) | 16.9% | 12.7% |
| Standard Deviation (Population) | 16.6% | 12.6% |
Similar Demographics by Single Male Poverty
Demographics Similar to Alaska Natives by Single Male Poverty
In terms of single male poverty, the demographic groups most similar to Alaska Natives are Aleut (15.4%, a difference of 0.11%), Blackfeet (15.5%, a difference of 0.53%), Pennsylvania German (15.6%, a difference of 0.96%), Alsatian (15.2%, a difference of 1.1%), and Dominican (15.2%, a difference of 1.3%).
| Demographics | Rating | Rank | Single Male Poverty |
| Immigrants | Dominican Republic | 0.0 /100 | #297 | Tragic 14.8% |
| French American Indians | 0.0 /100 | #298 | Tragic 15.0% |
| Delaware | 0.0 /100 | #299 | Tragic 15.0% |
| Cree | 0.0 /100 | #300 | Tragic 15.1% |
| Dominicans | 0.0 /100 | #301 | Tragic 15.2% |
| Alsatians | 0.0 /100 | #302 | Tragic 15.2% |
| Aleuts | 0.0 /100 | #303 | Tragic 15.4% |
| Alaska Natives | 0.0 /100 | #304 | Tragic 15.4% |
| Blackfeet | 0.0 /100 | #305 | Tragic 15.5% |
| Pennsylvania Germans | 0.0 /100 | #306 | Tragic 15.6% |
| Ute | 0.0 /100 | #307 | Tragic 15.7% |
| Potawatomi | 0.0 /100 | #308 | Tragic 15.8% |
| Americans | 0.0 /100 | #309 | Tragic 15.8% |
| Yakama | 0.0 /100 | #310 | Tragic 15.9% |
| Seminole | 0.0 /100 | #311 | Tragic 16.0% |
Demographics Similar to Immigrants from Guatemala by Single Male Poverty
In terms of single male poverty, the demographic groups most similar to Immigrants from Guatemala are Guatemalan (13.8%, a difference of 0.040%), Immigrants from Central America (13.8%, a difference of 0.070%), Swiss (13.8%, a difference of 0.11%), Hungarian (13.8%, a difference of 0.16%), and Immigrants from Belize (13.7%, a difference of 0.25%).
| Demographics | Rating | Rank | Single Male Poverty |
| Immigrants | Zaire | 0.9 /100 | #251 | Tragic 13.6% |
| Finns | 0.9 /100 | #252 | Tragic 13.6% |
| German Russians | 0.8 /100 | #253 | Tragic 13.6% |
| Sub-Saharan Africans | 0.5 /100 | #254 | Tragic 13.7% |
| Spaniards | 0.4 /100 | #255 | Tragic 13.7% |
| Immigrants | Belize | 0.4 /100 | #256 | Tragic 13.7% |
| Immigrants | Central America | 0.3 /100 | #257 | Tragic 13.8% |
| Immigrants | Guatemala | 0.3 /100 | #258 | Tragic 13.8% |
| Guatemalans | 0.3 /100 | #259 | Tragic 13.8% |
| Swiss | 0.3 /100 | #260 | Tragic 13.8% |
| Hungarians | 0.3 /100 | #261 | Tragic 13.8% |
| Fijians | 0.3 /100 | #262 | Tragic 13.8% |
| Cape Verdeans | 0.2 /100 | #263 | Tragic 13.8% |
| West Indians | 0.2 /100 | #264 | Tragic 13.8% |
| Immigrants | Congo | 0.2 /100 | #265 | Tragic 13.9% |