Alaska Native vs Delaware Single Male Poverty
COMPARE
Alaska Native
Delaware
Single Male Poverty
Single Male Poverty Comparison
Alaska Natives
Delaware
15.4%
SINGLE MALE POVERTY
0.0/ 100
METRIC RATING
304th/ 347
METRIC RANK
15.0%
SINGLE MALE POVERTY
0.0/ 100
METRIC RATING
299th/ 347
METRIC RANK
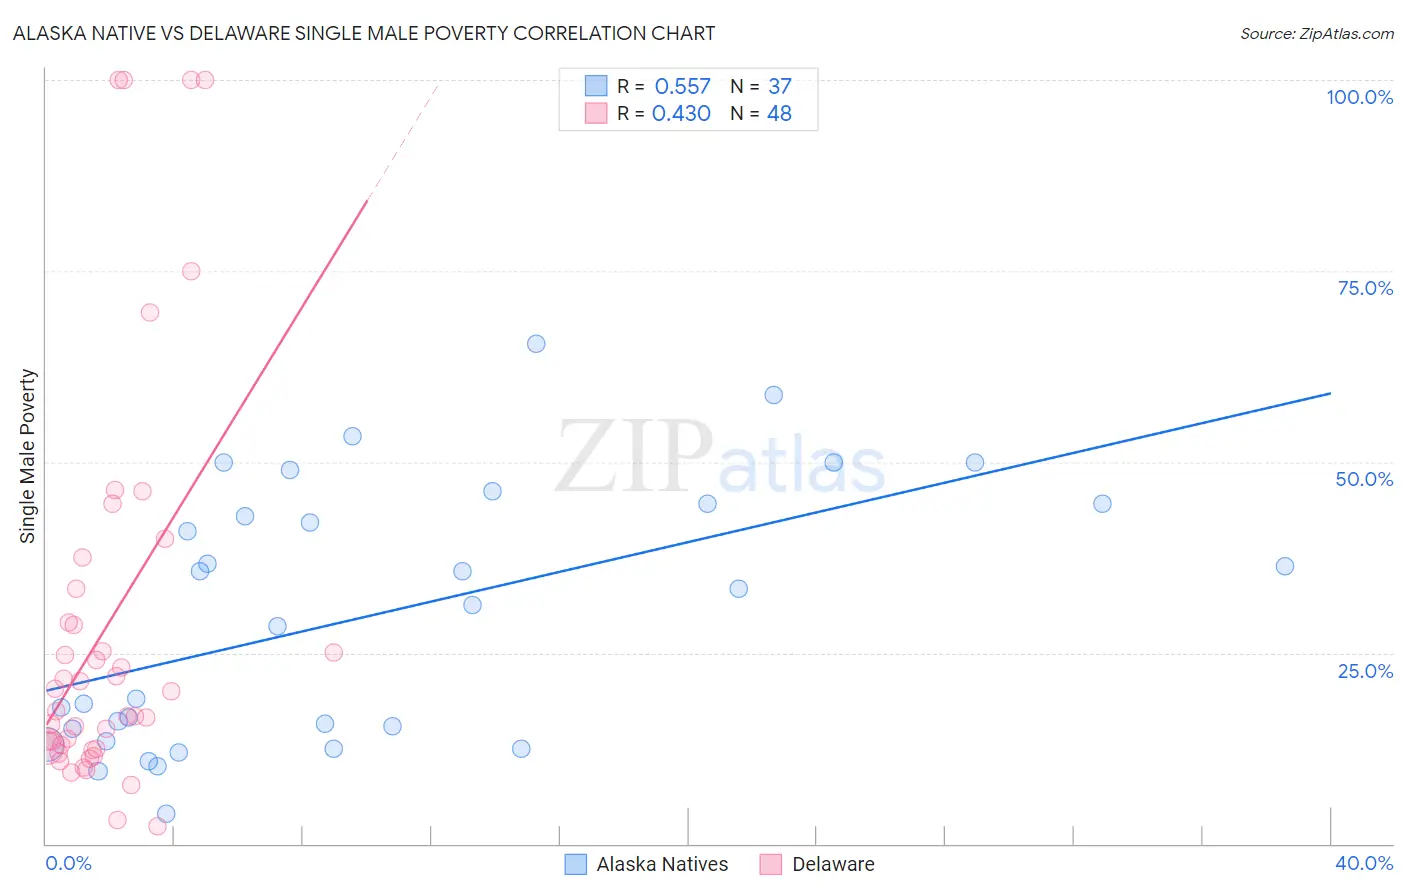
Alaska Native vs Delaware Single Male Poverty Correlation Chart
The statistical analysis conducted on geographies consisting of 74,357,121 people shows a substantial positive correlation between the proportion of Alaska Natives and poverty level among single males in the United States with a correlation coefficient (R) of 0.557 and weighted average of 15.4%. Similarly, the statistical analysis conducted on geographies consisting of 90,922,782 people shows a moderate positive correlation between the proportion of Delaware and poverty level among single males in the United States with a correlation coefficient (R) of 0.430 and weighted average of 15.0%, a difference of 2.6%.
Single Male Poverty Correlation Summary
| Measurement | Alaska Native | Delaware |
| Minimum | 4.0% | 2.4% |
| Maximum | 65.5% | 100.0% |
| Range | 61.5% | 97.6% |
| Mean | 29.9% | 28.5% |
| Median | 31.2% | 18.7% |
| Interquartile 25% (IQ1) | 14.2% | 12.6% |
| Interquartile 75% (IQ3) | 44.4% | 31.1% |
| Interquartile Range (IQR) | 30.2% | 18.5% |
| Standard Deviation (Sample) | 16.9% | 26.3% |
| Standard Deviation (Population) | 16.6% | 26.0% |
Demographics Similar to Alaska Natives and Delaware by Single Male Poverty
In terms of single male poverty, the demographic groups most similar to Alaska Natives are Aleut (15.4%, a difference of 0.11%), Blackfeet (15.5%, a difference of 0.53%), Pennsylvania German (15.6%, a difference of 0.96%), Alsatian (15.2%, a difference of 1.1%), and Dominican (15.2%, a difference of 1.3%). Similarly, the demographic groups most similar to Delaware are French American Indian (15.0%, a difference of 0.39%), Cree (15.1%, a difference of 0.45%), Dominican (15.2%, a difference of 1.3%), Alsatian (15.2%, a difference of 1.4%), and Immigrants from Dominican Republic (14.8%, a difference of 1.7%).
| Demographics | Rating | Rank | Single Male Poverty |
| Bahamians | 0.0 /100 | #291 | Tragic 14.6% |
| Immigrants | Nonimmigrants | 0.0 /100 | #292 | Tragic 14.6% |
| French Canadians | 0.0 /100 | #293 | Tragic 14.6% |
| Ottawa | 0.0 /100 | #294 | Tragic 14.6% |
| Scotch-Irish | 0.0 /100 | #295 | Tragic 14.7% |
| Africans | 0.0 /100 | #296 | Tragic 14.7% |
| Immigrants | Dominican Republic | 0.0 /100 | #297 | Tragic 14.8% |
| French American Indians | 0.0 /100 | #298 | Tragic 15.0% |
| Delaware | 0.0 /100 | #299 | Tragic 15.0% |
| Cree | 0.0 /100 | #300 | Tragic 15.1% |
| Dominicans | 0.0 /100 | #301 | Tragic 15.2% |
| Alsatians | 0.0 /100 | #302 | Tragic 15.2% |
| Aleuts | 0.0 /100 | #303 | Tragic 15.4% |
| Alaska Natives | 0.0 /100 | #304 | Tragic 15.4% |
| Blackfeet | 0.0 /100 | #305 | Tragic 15.5% |
| Pennsylvania Germans | 0.0 /100 | #306 | Tragic 15.6% |
| Ute | 0.0 /100 | #307 | Tragic 15.7% |
| Potawatomi | 0.0 /100 | #308 | Tragic 15.8% |
| Americans | 0.0 /100 | #309 | Tragic 15.8% |
| Yakama | 0.0 /100 | #310 | Tragic 15.9% |
| Seminole | 0.0 /100 | #311 | Tragic 16.0% |