African vs Immigrants from Senegal Hearing Disability
COMPARE
African
Immigrants from Senegal
Hearing Disability
Hearing Disability Comparison
Africans
Immigrants from Senegal
3.0%
HEARING DISABILITY
32.9/ 100
METRIC RATING
189th/ 347
METRIC RANK
2.6%
HEARING DISABILITY
99.7/ 100
METRIC RATING
26th/ 347
METRIC RANK
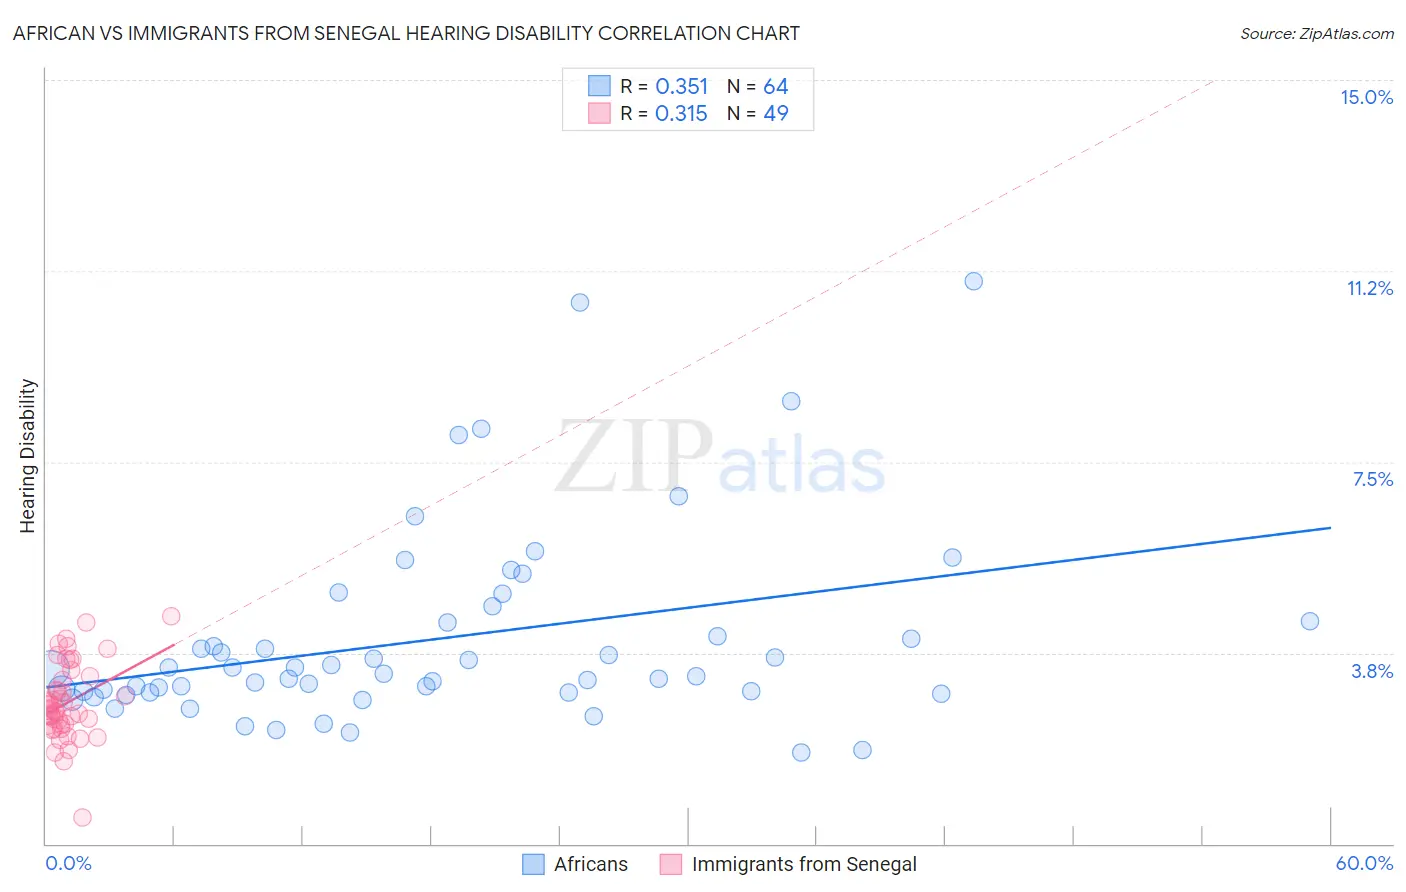
African vs Immigrants from Senegal Hearing Disability Correlation Chart
The statistical analysis conducted on geographies consisting of 469,733,776 people shows a mild positive correlation between the proportion of Africans and percentage of population with hearing disability in the United States with a correlation coefficient (R) of 0.351 and weighted average of 3.0%. Similarly, the statistical analysis conducted on geographies consisting of 90,120,921 people shows a mild positive correlation between the proportion of Immigrants from Senegal and percentage of population with hearing disability in the United States with a correlation coefficient (R) of 0.315 and weighted average of 2.6%, a difference of 18.0%.
Hearing Disability Correlation Summary
| Measurement | African | Immigrants from Senegal |
| Minimum | 1.8% | 0.50% |
| Maximum | 11.1% | 4.5% |
| Range | 9.3% | 4.0% |
| Mean | 4.0% | 2.8% |
| Median | 3.4% | 2.6% |
| Interquartile 25% (IQ1) | 3.0% | 2.3% |
| Interquartile 75% (IQ3) | 4.4% | 3.3% |
| Interquartile Range (IQR) | 1.4% | 0.92% |
| Standard Deviation (Sample) | 1.9% | 0.75% |
| Standard Deviation (Population) | 1.9% | 0.74% |
Similar Demographics by Hearing Disability
Demographics Similar to Africans by Hearing Disability
In terms of hearing disability, the demographic groups most similar to Africans are Black/African American (3.0%, a difference of 0.19%), Mexican American Indian (3.0%, a difference of 0.19%), Immigrants from South Africa (3.1%, a difference of 0.19%), Immigrants from Mexico (3.0%, a difference of 0.21%), and Immigrants from Southern Europe (3.0%, a difference of 0.25%).
| Demographics | Rating | Rank | Hearing Disability |
| Immigrants | Italy | 41.1 /100 | #182 | Average 3.0% |
| Bulgarians | 39.7 /100 | #183 | Fair 3.0% |
| Immigrants | Ireland | 37.4 /100 | #184 | Fair 3.0% |
| Immigrants | Southern Europe | 35.3 /100 | #185 | Fair 3.0% |
| Immigrants | Mexico | 34.9 /100 | #186 | Fair 3.0% |
| Blacks/African Americans | 34.7 /100 | #187 | Fair 3.0% |
| Mexican American Indians | 34.7 /100 | #188 | Fair 3.0% |
| Africans | 32.9 /100 | #189 | Fair 3.0% |
| Immigrants | South Africa | 31.1 /100 | #190 | Fair 3.1% |
| Immigrants | Switzerland | 28.8 /100 | #191 | Fair 3.1% |
| Koreans | 27.6 /100 | #192 | Fair 3.1% |
| Macedonians | 27.0 /100 | #193 | Fair 3.1% |
| South Africans | 24.5 /100 | #194 | Fair 3.1% |
| Spanish American Indians | 24.1 /100 | #195 | Fair 3.1% |
| Immigrants | Europe | 22.9 /100 | #196 | Fair 3.1% |
Demographics Similar to Immigrants from Senegal by Hearing Disability
In terms of hearing disability, the demographic groups most similar to Immigrants from Senegal are Immigrants from El Salvador (2.6%, a difference of 0.010%), Immigrants from South Central Asia (2.6%, a difference of 0.040%), Immigrants from Ghana (2.6%, a difference of 0.41%), Immigrants from Haiti (2.6%, a difference of 0.41%), and Bolivian (2.6%, a difference of 0.43%).
| Demographics | Rating | Rank | Hearing Disability |
| Thais | 99.8 /100 | #19 | Exceptional 2.5% |
| Immigrants | Bolivia | 99.8 /100 | #20 | Exceptional 2.5% |
| Ghanaians | 99.8 /100 | #21 | Exceptional 2.5% |
| Immigrants | Sierra Leone | 99.8 /100 | #22 | Exceptional 2.6% |
| Immigrants | Nigeria | 99.8 /100 | #23 | Exceptional 2.6% |
| Immigrants | Ghana | 99.8 /100 | #24 | Exceptional 2.6% |
| Immigrants | El Salvador | 99.7 /100 | #25 | Exceptional 2.6% |
| Immigrants | Senegal | 99.7 /100 | #26 | Exceptional 2.6% |
| Immigrants | South Central Asia | 99.7 /100 | #27 | Exceptional 2.6% |
| Immigrants | Haiti | 99.7 /100 | #28 | Exceptional 2.6% |
| Bolivians | 99.7 /100 | #29 | Exceptional 2.6% |
| Immigrants | Caribbean | 99.7 /100 | #30 | Exceptional 2.6% |
| Immigrants | Cameroon | 99.7 /100 | #31 | Exceptional 2.6% |
| Immigrants | Venezuela | 99.7 /100 | #32 | Exceptional 2.6% |
| Filipinos | 99.6 /100 | #33 | Exceptional 2.6% |