African vs Immigrants from Senegal 5th Grade
COMPARE
African
Immigrants from Senegal
5th Grade
5th Grade Comparison
Africans
Immigrants from Senegal
97.2%
5TH GRADE
15.3/ 100
METRIC RATING
202nd/ 347
METRIC RANK
96.8%
5TH GRADE
0.8/ 100
METRIC RATING
254th/ 347
METRIC RANK
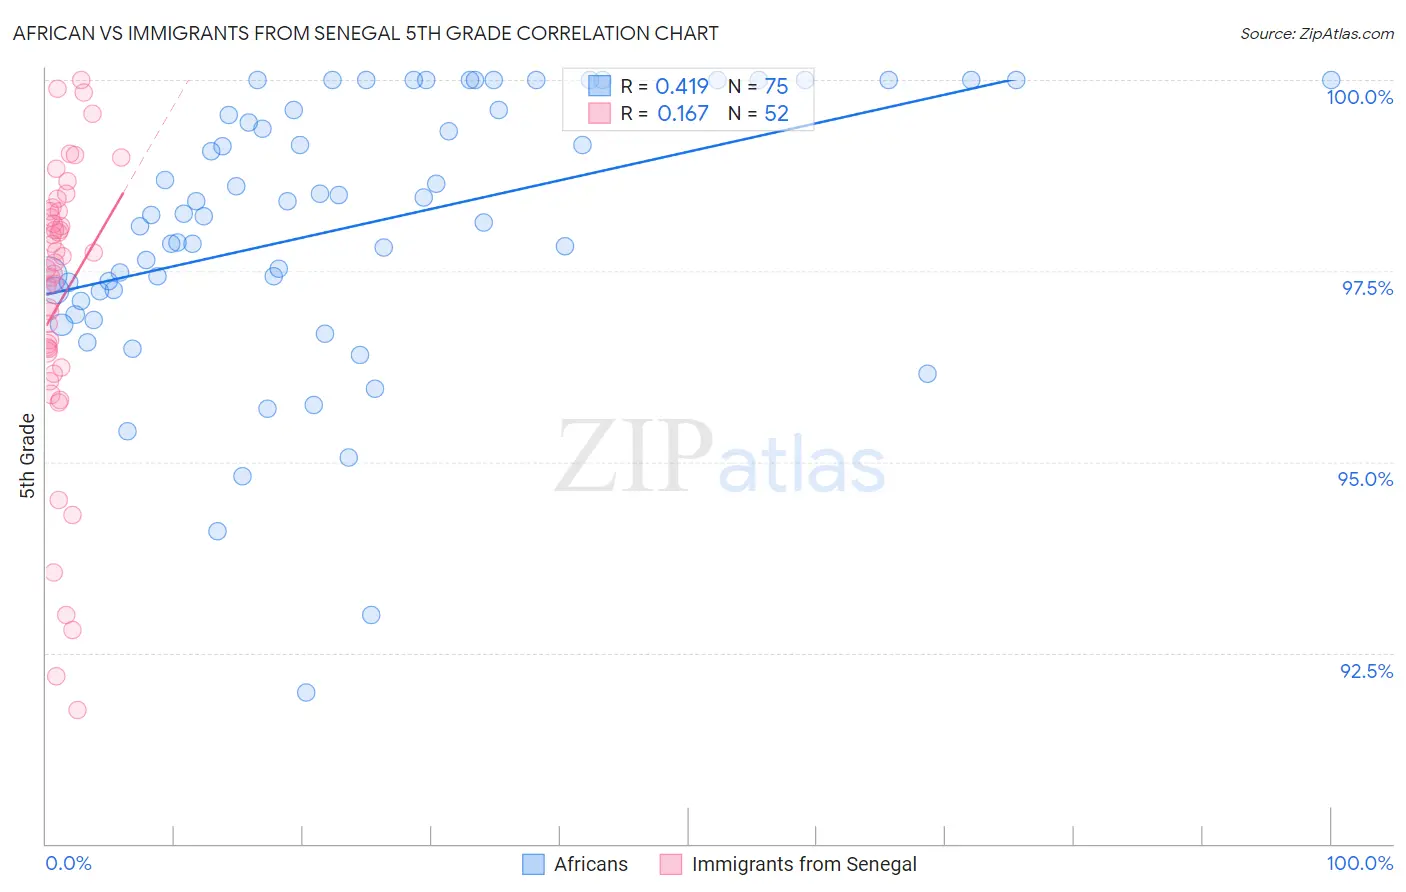
African vs Immigrants from Senegal 5th Grade Correlation Chart
The statistical analysis conducted on geographies consisting of 470,094,744 people shows a moderate positive correlation between the proportion of Africans and percentage of population with at least 5th grade education in the United States with a correlation coefficient (R) of 0.419 and weighted average of 97.2%. Similarly, the statistical analysis conducted on geographies consisting of 90,130,297 people shows a poor positive correlation between the proportion of Immigrants from Senegal and percentage of population with at least 5th grade education in the United States with a correlation coefficient (R) of 0.167 and weighted average of 96.8%, a difference of 0.33%.
5th Grade Correlation Summary
| Measurement | African | Immigrants from Senegal |
| Minimum | 92.0% | 91.8% |
| Maximum | 100.0% | 100.0% |
| Range | 8.0% | 8.2% |
| Mean | 98.1% | 97.1% |
| Median | 98.2% | 97.6% |
| Interquartile 25% (IQ1) | 97.2% | 96.3% |
| Interquartile 75% (IQ3) | 99.6% | 98.3% |
| Interquartile Range (IQR) | 2.4% | 1.9% |
| Standard Deviation (Sample) | 1.8% | 1.9% |
| Standard Deviation (Population) | 1.8% | 1.9% |
Similar Demographics by 5th Grade
Demographics Similar to Africans by 5th Grade
In terms of 5th grade, the demographic groups most similar to Africans are Immigrants from Bahamas (97.2%, a difference of 0.0%), Immigrants from Northern Africa (97.2%, a difference of 0.010%), Immigrants from Chile (97.2%, a difference of 0.010%), Immigrants from Zaire (97.1%, a difference of 0.010%), and Native/Alaskan (97.2%, a difference of 0.020%).
| Demographics | Rating | Rank | 5th Grade |
| Guamanians/Chamorros | 26.8 /100 | #195 | Fair 97.2% |
| Hawaiians | 25.6 /100 | #196 | Fair 97.2% |
| Brazilians | 25.4 /100 | #197 | Fair 97.2% |
| Immigrants | Uganda | 21.1 /100 | #198 | Fair 97.2% |
| Natives/Alaskans | 18.0 /100 | #199 | Poor 97.2% |
| Immigrants | Northern Africa | 16.8 /100 | #200 | Poor 97.2% |
| Immigrants | Chile | 16.6 /100 | #201 | Poor 97.2% |
| Africans | 15.3 /100 | #202 | Poor 97.2% |
| Immigrants | Bahamas | 14.9 /100 | #203 | Poor 97.2% |
| Immigrants | Zaire | 13.7 /100 | #204 | Poor 97.1% |
| Moroccans | 12.0 /100 | #205 | Poor 97.1% |
| Paiute | 11.6 /100 | #206 | Poor 97.1% |
| Iraqis | 10.9 /100 | #207 | Poor 97.1% |
| Laotians | 10.8 /100 | #208 | Poor 97.1% |
| Immigrants | Nepal | 10.3 /100 | #209 | Poor 97.1% |
Demographics Similar to Immigrants from Senegal by 5th Grade
In terms of 5th grade, the demographic groups most similar to Immigrants from Senegal are Immigrants from Middle Africa (96.8%, a difference of 0.010%), Immigrants from Uruguay (96.9%, a difference of 0.020%), Immigrants from Liberia (96.9%, a difference of 0.020%), Bolivian (96.9%, a difference of 0.020%), and Jamaican (96.9%, a difference of 0.020%).
| Demographics | Rating | Rank | 5th Grade |
| Immigrants | Africa | 1.1 /100 | #247 | Tragic 96.9% |
| U.S. Virgin Islanders | 1.1 /100 | #248 | Tragic 96.9% |
| Immigrants | Uruguay | 1.0 /100 | #249 | Tragic 96.9% |
| Immigrants | Liberia | 1.0 /100 | #250 | Tragic 96.9% |
| Bolivians | 0.9 /100 | #251 | Tragic 96.9% |
| Jamaicans | 0.9 /100 | #252 | Tragic 96.9% |
| Immigrants | Middle Africa | 0.8 /100 | #253 | Tragic 96.8% |
| Immigrants | Senegal | 0.8 /100 | #254 | Tragic 96.8% |
| South Americans | 0.7 /100 | #255 | Tragic 96.8% |
| Immigrants | Congo | 0.7 /100 | #256 | Tragic 96.8% |
| Peruvians | 0.6 /100 | #257 | Tragic 96.8% |
| Immigrants | Ethiopia | 0.5 /100 | #258 | Tragic 96.8% |
| Immigrants | China | 0.5 /100 | #259 | Tragic 96.8% |
| Immigrants | Jamaica | 0.4 /100 | #260 | Tragic 96.8% |
| Immigrants | Sierra Leone | 0.4 /100 | #261 | Tragic 96.8% |