African vs Immigrants from Laos Single Father Poverty
COMPARE
African
Immigrants from Laos
Single Father Poverty
Single Father Poverty Comparison
Africans
Immigrants from Laos
18.3%
SINGLE FATHER POVERTY
0.0/ 100
METRIC RATING
298th/ 347
METRIC RANK
15.1%
SINGLE FATHER POVERTY
99.9/ 100
METRIC RATING
56th/ 347
METRIC RANK
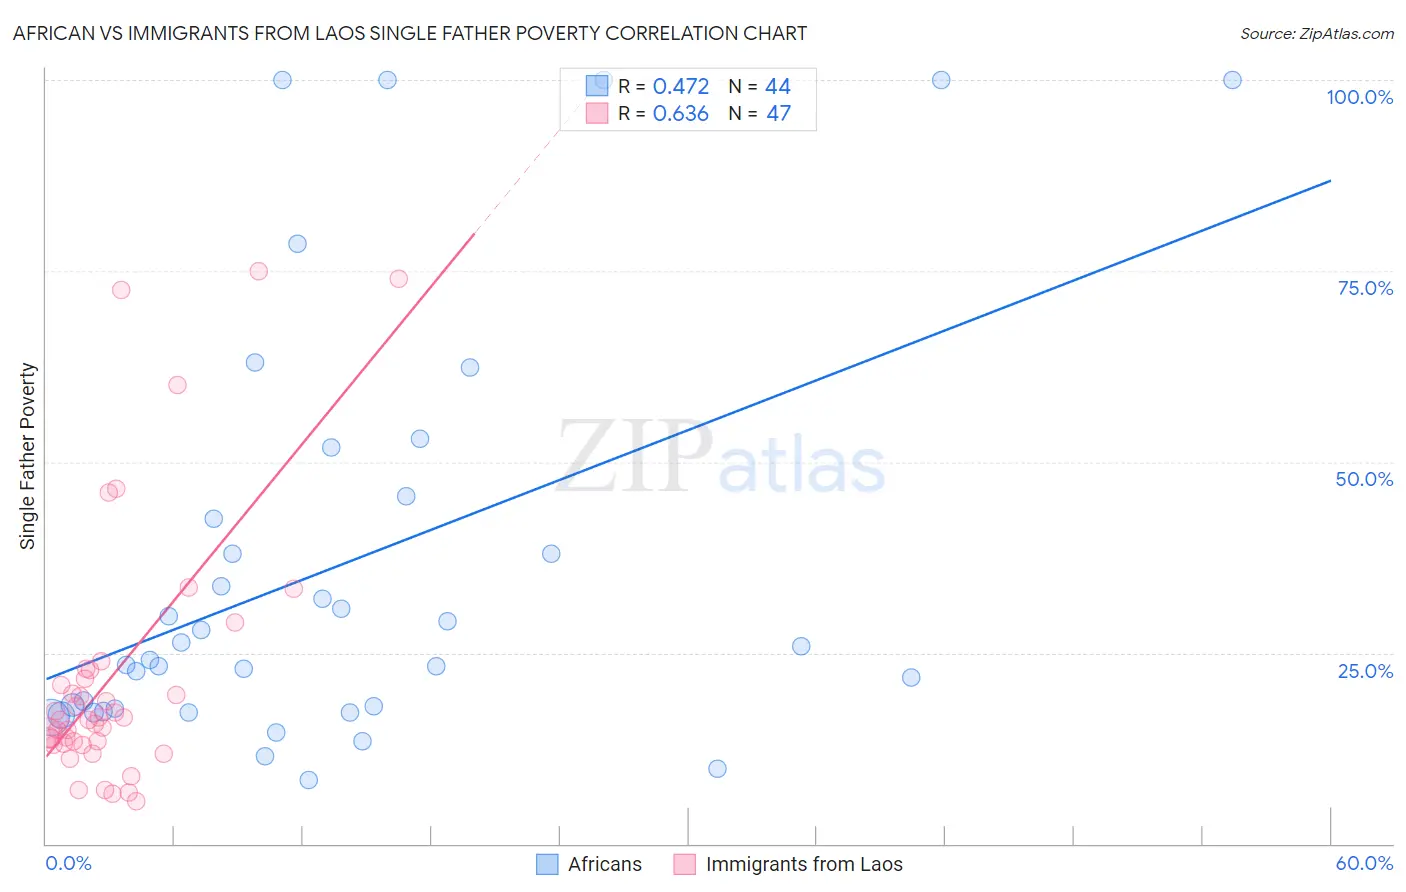
African vs Immigrants from Laos Single Father Poverty Correlation Chart
The statistical analysis conducted on geographies consisting of 369,651,911 people shows a moderate positive correlation between the proportion of Africans and poverty level among single fathers in the United States with a correlation coefficient (R) of 0.472 and weighted average of 18.3%. Similarly, the statistical analysis conducted on geographies consisting of 175,462,084 people shows a significant positive correlation between the proportion of Immigrants from Laos and poverty level among single fathers in the United States with a correlation coefficient (R) of 0.636 and weighted average of 15.1%, a difference of 21.6%.
Single Father Poverty Correlation Summary
| Measurement | African | Immigrants from Laos |
| Minimum | 8.3% | 5.5% |
| Maximum | 100.0% | 75.0% |
| Range | 91.7% | 69.5% |
| Mean | 36.4% | 22.0% |
| Median | 25.0% | 16.2% |
| Interquartile 25% (IQ1) | 17.5% | 13.2% |
| Interquartile 75% (IQ3) | 44.0% | 22.7% |
| Interquartile Range (IQR) | 26.5% | 9.6% |
| Standard Deviation (Sample) | 27.5% | 17.3% |
| Standard Deviation (Population) | 27.1% | 17.1% |
Similar Demographics by Single Father Poverty
Demographics Similar to Africans by Single Father Poverty
In terms of single father poverty, the demographic groups most similar to Africans are White/Caucasian (18.4%, a difference of 0.21%), Immigrants from Dominican Republic (18.4%, a difference of 0.53%), French (18.2%, a difference of 0.75%), Hungarian (18.5%, a difference of 0.75%), and Comanche (18.5%, a difference of 0.86%).
| Demographics | Rating | Rank | Single Father Poverty |
| Alaskan Athabascans | 0.0 /100 | #291 | Tragic 18.1% |
| Immigrants | Bahamas | 0.0 /100 | #292 | Tragic 18.1% |
| Alaska Natives | 0.0 /100 | #293 | Tragic 18.1% |
| U.S. Virgin Islanders | 0.0 /100 | #294 | Tragic 18.1% |
| Yakama | 0.0 /100 | #295 | Tragic 18.1% |
| Seminole | 0.0 /100 | #296 | Tragic 18.1% |
| French | 0.0 /100 | #297 | Tragic 18.2% |
| Africans | 0.0 /100 | #298 | Tragic 18.3% |
| Whites/Caucasians | 0.0 /100 | #299 | Tragic 18.4% |
| Immigrants | Dominican Republic | 0.0 /100 | #300 | Tragic 18.4% |
| Hungarians | 0.0 /100 | #301 | Tragic 18.5% |
| Comanche | 0.0 /100 | #302 | Tragic 18.5% |
| Celtics | 0.0 /100 | #303 | Tragic 18.5% |
| Ute | 0.0 /100 | #304 | Tragic 18.5% |
| Blackfeet | 0.0 /100 | #305 | Tragic 18.5% |
Demographics Similar to Immigrants from Laos by Single Father Poverty
In terms of single father poverty, the demographic groups most similar to Immigrants from Laos are Laotian (15.1%, a difference of 0.090%), Hawaiian (15.1%, a difference of 0.14%), Guamanian/Chamorro (15.1%, a difference of 0.24%), Immigrants from Bulgaria (15.0%, a difference of 0.28%), and Immigrants from Uzbekistan (15.0%, a difference of 0.32%).
| Demographics | Rating | Rank | Single Father Poverty |
| Immigrants | Eastern Asia | 99.9 /100 | #49 | Exceptional 15.0% |
| Bhutanese | 99.9 /100 | #50 | Exceptional 15.0% |
| Immigrants | Pakistan | 99.9 /100 | #51 | Exceptional 15.0% |
| Immigrants | El Salvador | 99.9 /100 | #52 | Exceptional 15.0% |
| Immigrants | Kenya | 99.9 /100 | #53 | Exceptional 15.0% |
| Immigrants | Uzbekistan | 99.9 /100 | #54 | Exceptional 15.0% |
| Immigrants | Bulgaria | 99.9 /100 | #55 | Exceptional 15.0% |
| Immigrants | Laos | 99.9 /100 | #56 | Exceptional 15.1% |
| Laotians | 99.9 /100 | #57 | Exceptional 15.1% |
| Hawaiians | 99.9 /100 | #58 | Exceptional 15.1% |
| Guamanians/Chamorros | 99.9 /100 | #59 | Exceptional 15.1% |
| Puget Sound Salish | 99.8 /100 | #60 | Exceptional 15.2% |
| Immigrants | Bosnia and Herzegovina | 99.8 /100 | #61 | Exceptional 15.2% |
| Immigrants | Armenia | 99.8 /100 | #62 | Exceptional 15.2% |
| Immigrants | Sweden | 99.8 /100 | #63 | Exceptional 15.2% |