African vs Immigrants from Senegal 8th Grade
COMPARE
African
Immigrants from Senegal
8th Grade
8th Grade Comparison
Africans
Immigrants from Senegal
95.4%
8TH GRADE
13.6/ 100
METRIC RATING
210th/ 347
METRIC RANK
95.1%
8TH GRADE
1.4/ 100
METRIC RATING
247th/ 347
METRIC RANK
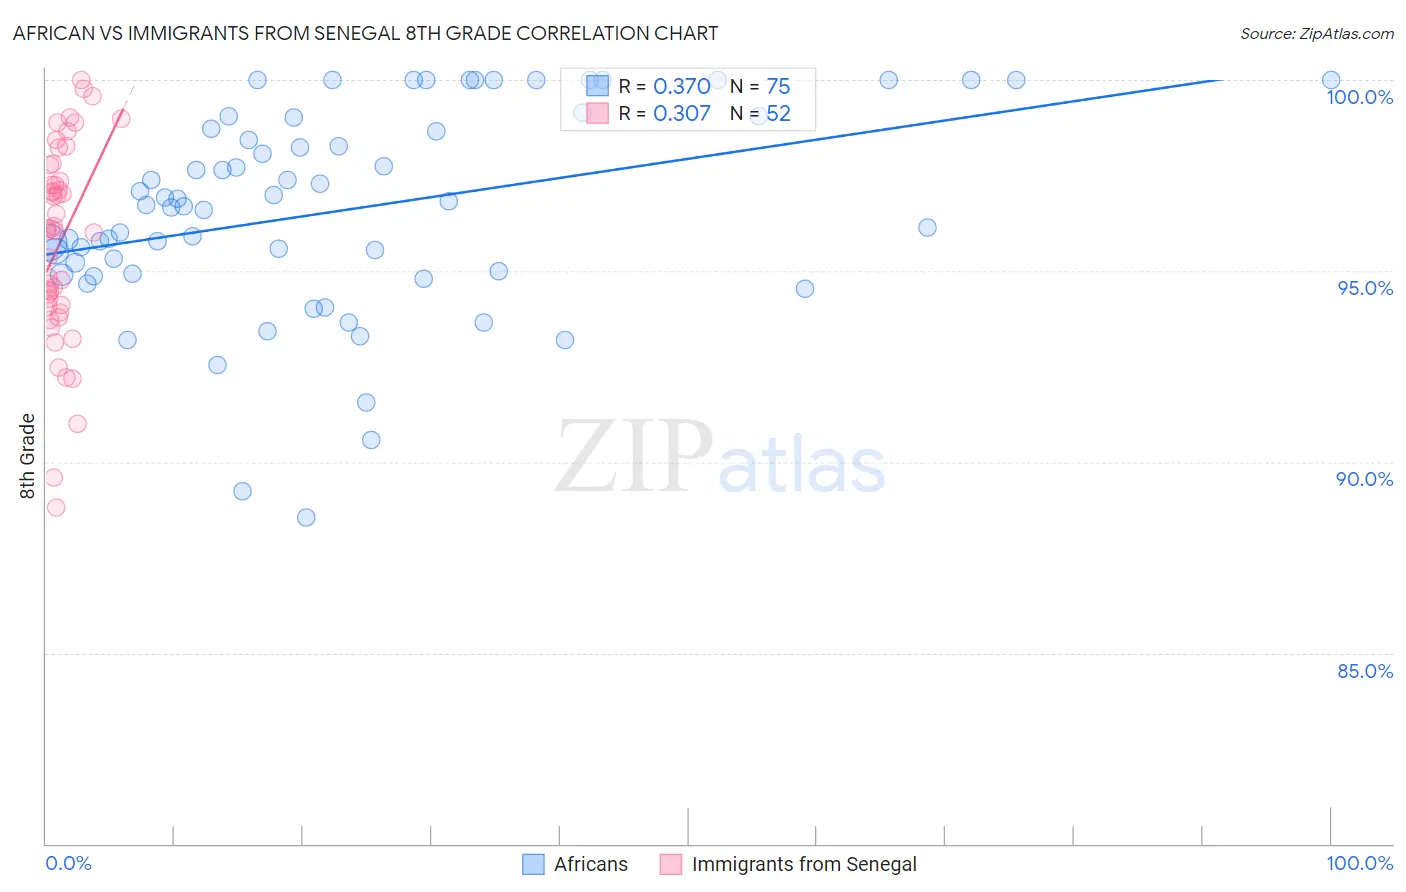
African vs Immigrants from Senegal 8th Grade Correlation Chart
The statistical analysis conducted on geographies consisting of 470,094,744 people shows a mild positive correlation between the proportion of Africans and percentage of population with at least 8th grade education in the United States with a correlation coefficient (R) of 0.370 and weighted average of 95.4%. Similarly, the statistical analysis conducted on geographies consisting of 90,130,297 people shows a mild positive correlation between the proportion of Immigrants from Senegal and percentage of population with at least 8th grade education in the United States with a correlation coefficient (R) of 0.307 and weighted average of 95.1%, a difference of 0.40%.
8th Grade Correlation Summary
| Measurement | African | Immigrants from Senegal |
| Minimum | 88.6% | 88.8% |
| Maximum | 100.0% | 100.0% |
| Range | 11.4% | 11.2% |
| Mean | 96.6% | 95.7% |
| Median | 96.7% | 96.1% |
| Interquartile 25% (IQ1) | 94.9% | 94.1% |
| Interquartile 75% (IQ3) | 99.0% | 97.6% |
| Interquartile Range (IQR) | 4.1% | 3.5% |
| Standard Deviation (Sample) | 2.7% | 2.6% |
| Standard Deviation (Population) | 2.7% | 2.5% |
Similar Demographics by 8th Grade
Demographics Similar to Africans by 8th Grade
In terms of 8th grade, the demographic groups most similar to Africans are Immigrants from Lebanon (95.4%, a difference of 0.0%), Portuguese (95.5%, a difference of 0.010%), Immigrants from Sudan (95.5%, a difference of 0.020%), Immigrants from Morocco (95.4%, a difference of 0.020%), and Hawaiian (95.5%, a difference of 0.040%).
| Demographics | Rating | Rank | 8th Grade |
| Moroccans | 17.4 /100 | #203 | Poor 95.5% |
| Hawaiians | 16.7 /100 | #204 | Poor 95.5% |
| Immigrants | Bahamas | 16.7 /100 | #205 | Poor 95.5% |
| Comanche | 16.3 /100 | #206 | Poor 95.5% |
| Immigrants | Sudan | 15.1 /100 | #207 | Poor 95.5% |
| Portuguese | 14.3 /100 | #208 | Poor 95.5% |
| Immigrants | Lebanon | 13.7 /100 | #209 | Poor 95.4% |
| Africans | 13.6 /100 | #210 | Poor 95.4% |
| Immigrants | Morocco | 12.4 /100 | #211 | Poor 95.4% |
| Immigrants | Pakistan | 9.7 /100 | #212 | Tragic 95.4% |
| Laotians | 9.0 /100 | #213 | Tragic 95.4% |
| Immigrants | Chile | 9.0 /100 | #214 | Tragic 95.4% |
| Immigrants | Liberia | 8.9 /100 | #215 | Tragic 95.4% |
| Samoans | 8.4 /100 | #216 | Tragic 95.4% |
| Immigrants | Eastern Asia | 8.3 /100 | #217 | Tragic 95.4% |
Demographics Similar to Immigrants from Senegal by 8th Grade
In terms of 8th grade, the demographic groups most similar to Immigrants from Senegal are Somali (95.1%, a difference of 0.0%), Jamaican (95.1%, a difference of 0.010%), Uruguayan (95.1%, a difference of 0.010%), Tongan (95.1%, a difference of 0.040%), and Paiute (95.1%, a difference of 0.040%).
| Demographics | Rating | Rank | 8th Grade |
| Ethiopians | 2.0 /100 | #240 | Tragic 95.1% |
| South American Indians | 1.9 /100 | #241 | Tragic 95.1% |
| Tongans | 1.7 /100 | #242 | Tragic 95.1% |
| Paiute | 1.7 /100 | #243 | Tragic 95.1% |
| Immigrants | Middle Africa | 1.7 /100 | #244 | Tragic 95.1% |
| Jamaicans | 1.4 /100 | #245 | Tragic 95.1% |
| Somalis | 1.4 /100 | #246 | Tragic 95.1% |
| Immigrants | Senegal | 1.4 /100 | #247 | Tragic 95.1% |
| Uruguayans | 1.2 /100 | #248 | Tragic 95.1% |
| Immigrants | China | 1.1 /100 | #249 | Tragic 95.0% |
| Koreans | 1.1 /100 | #250 | Tragic 95.0% |
| Bolivians | 1.0 /100 | #251 | Tragic 95.0% |
| Immigrants | Ethiopia | 1.0 /100 | #252 | Tragic 95.0% |
| U.S. Virgin Islanders | 0.9 /100 | #253 | Tragic 95.0% |
| Immigrants | Cameroon | 0.8 /100 | #254 | Tragic 95.0% |