African vs Creek Disability Age 65 to 74
COMPARE
African
Creek
Disability Age 65 to 74
Disability Age 65 to 74 Comparison
Africans
Creek
26.2%
DISABILITY AGE 65 TO 74
0.0/ 100
METRIC RATING
289th/ 347
METRIC RANK
30.2%
DISABILITY AGE 65 TO 74
0.0/ 100
METRIC RATING
330th/ 347
METRIC RANK
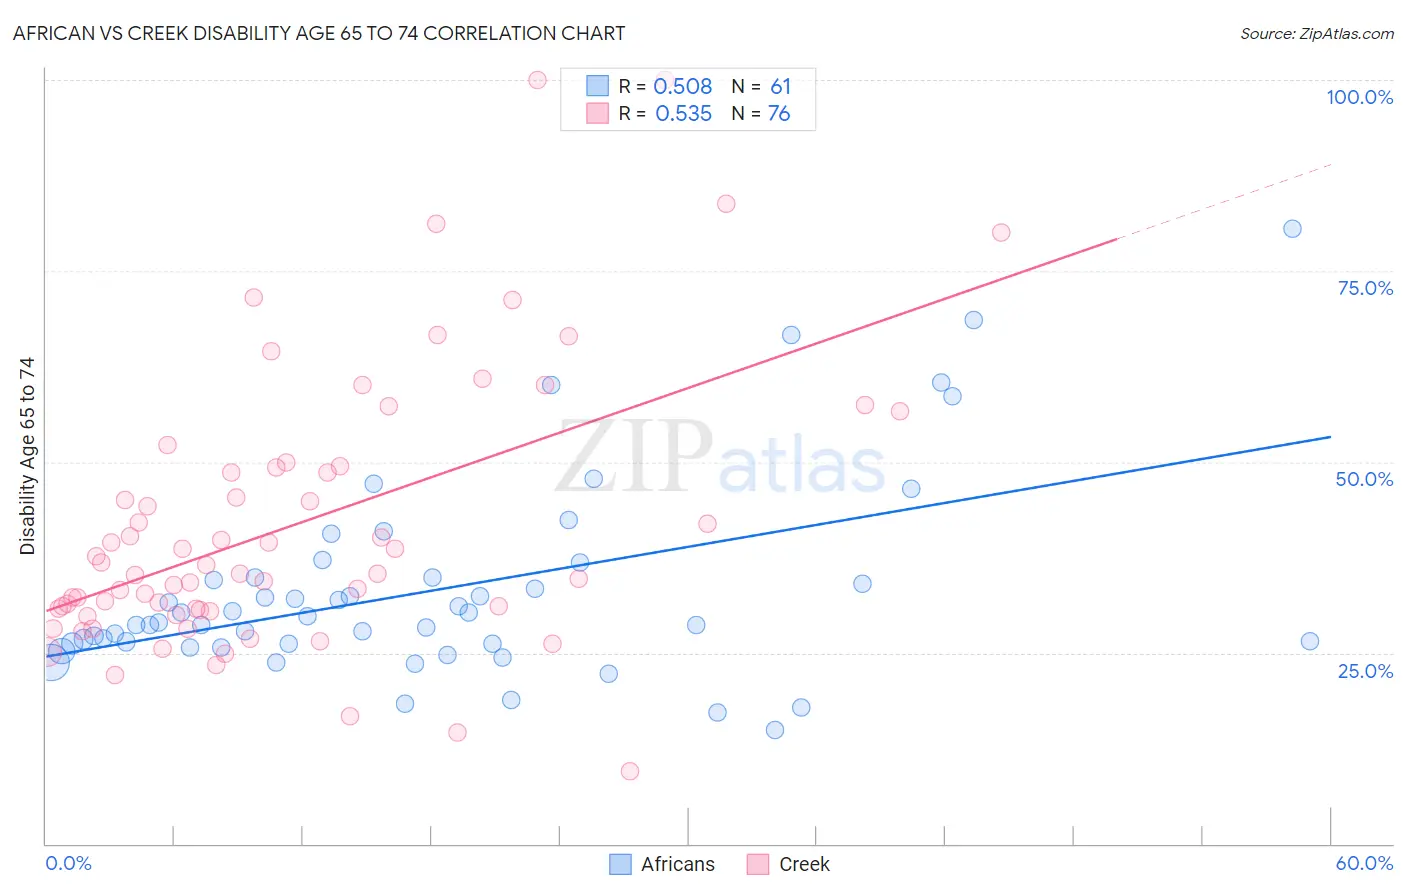
African vs Creek Disability Age 65 to 74 Correlation Chart
The statistical analysis conducted on geographies consisting of 468,706,770 people shows a substantial positive correlation between the proportion of Africans and percentage of population with a disability between the ages 65 and 75 in the United States with a correlation coefficient (R) of 0.508 and weighted average of 26.2%. Similarly, the statistical analysis conducted on geographies consisting of 178,280,252 people shows a substantial positive correlation between the proportion of Creek and percentage of population with a disability between the ages 65 and 75 in the United States with a correlation coefficient (R) of 0.535 and weighted average of 30.2%, a difference of 15.1%.
Disability Age 65 to 74 Correlation Summary
| Measurement | African | Creek |
| Minimum | 14.8% | 9.4% |
| Maximum | 80.6% | 100.0% |
| Range | 65.7% | 90.6% |
| Mean | 33.2% | 41.9% |
| Median | 29.0% | 35.9% |
| Interquartile 25% (IQ1) | 26.2% | 30.7% |
| Interquartile 75% (IQ3) | 34.8% | 49.3% |
| Interquartile Range (IQR) | 8.6% | 18.6% |
| Standard Deviation (Sample) | 13.0% | 18.2% |
| Standard Deviation (Population) | 12.9% | 18.1% |
Similar Demographics by Disability Age 65 to 74
Demographics Similar to Africans by Disability Age 65 to 74
In terms of disability age 65 to 74, the demographic groups most similar to Africans are Immigrants from Cabo Verde (26.3%, a difference of 0.31%), Mexican American Indian (26.2%, a difference of 0.32%), Immigrants from Laos (26.1%, a difference of 0.41%), Immigrants from Micronesia (26.1%, a difference of 0.48%), and Spanish American Indian (26.4%, a difference of 0.50%).
| Demographics | Rating | Rank | Disability Age 65 to 74 |
| Delaware | 0.1 /100 | #282 | Tragic 25.9% |
| Spanish Americans | 0.0 /100 | #283 | Tragic 25.9% |
| Immigrants | Azores | 0.0 /100 | #284 | Tragic 26.0% |
| Immigrants | Congo | 0.0 /100 | #285 | Tragic 26.0% |
| Immigrants | Micronesia | 0.0 /100 | #286 | Tragic 26.1% |
| Immigrants | Laos | 0.0 /100 | #287 | Tragic 26.1% |
| Mexican American Indians | 0.0 /100 | #288 | Tragic 26.2% |
| Africans | 0.0 /100 | #289 | Tragic 26.2% |
| Immigrants | Cabo Verde | 0.0 /100 | #290 | Tragic 26.3% |
| Spanish American Indians | 0.0 /100 | #291 | Tragic 26.4% |
| Blackfeet | 0.0 /100 | #292 | Tragic 26.6% |
| Immigrants | Central America | 0.0 /100 | #293 | Tragic 26.6% |
| Dominicans | 0.0 /100 | #294 | Tragic 26.7% |
| Hispanics or Latinos | 0.0 /100 | #295 | Tragic 26.7% |
| Bangladeshis | 0.0 /100 | #296 | Tragic 26.8% |
Demographics Similar to Creek by Disability Age 65 to 74
In terms of disability age 65 to 74, the demographic groups most similar to Creek are Chickasaw (30.2%, a difference of 0.010%), Choctaw (30.2%, a difference of 0.030%), Native/Alaskan (30.4%, a difference of 0.63%), Hopi (30.0%, a difference of 0.83%), and Colville (30.5%, a difference of 1.1%).
| Demographics | Rating | Rank | Disability Age 65 to 74 |
| Puerto Ricans | 0.0 /100 | #323 | Tragic 29.1% |
| Seminole | 0.0 /100 | #324 | Tragic 29.4% |
| Dutch West Indians | 0.0 /100 | #325 | Tragic 29.6% |
| Yakama | 0.0 /100 | #326 | Tragic 29.6% |
| Apache | 0.0 /100 | #327 | Tragic 29.7% |
| Hopi | 0.0 /100 | #328 | Tragic 30.0% |
| Choctaw | 0.0 /100 | #329 | Tragic 30.2% |
| Creek | 0.0 /100 | #330 | Tragic 30.2% |
| Chickasaw | 0.0 /100 | #331 | Tragic 30.2% |
| Natives/Alaskans | 0.0 /100 | #332 | Tragic 30.4% |
| Colville | 0.0 /100 | #333 | Tragic 30.5% |
| Alaska Natives | 0.0 /100 | #334 | Tragic 30.6% |
| Cheyenne | 0.0 /100 | #335 | Tragic 31.1% |
| Yuman | 0.0 /100 | #336 | Tragic 31.5% |
| Houma | 0.0 /100 | #337 | Tragic 32.3% |