Afghan vs English Single Mother Poverty
COMPARE
Afghan
English
Single Mother Poverty
Single Mother Poverty Comparison
Afghans
English
27.7%
SINGLE MOTHER POVERTY
98.5/ 100
METRIC RATING
87th/ 347
METRIC RANK
30.2%
SINGLE MOTHER POVERTY
4.8/ 100
METRIC RATING
230th/ 347
METRIC RANK
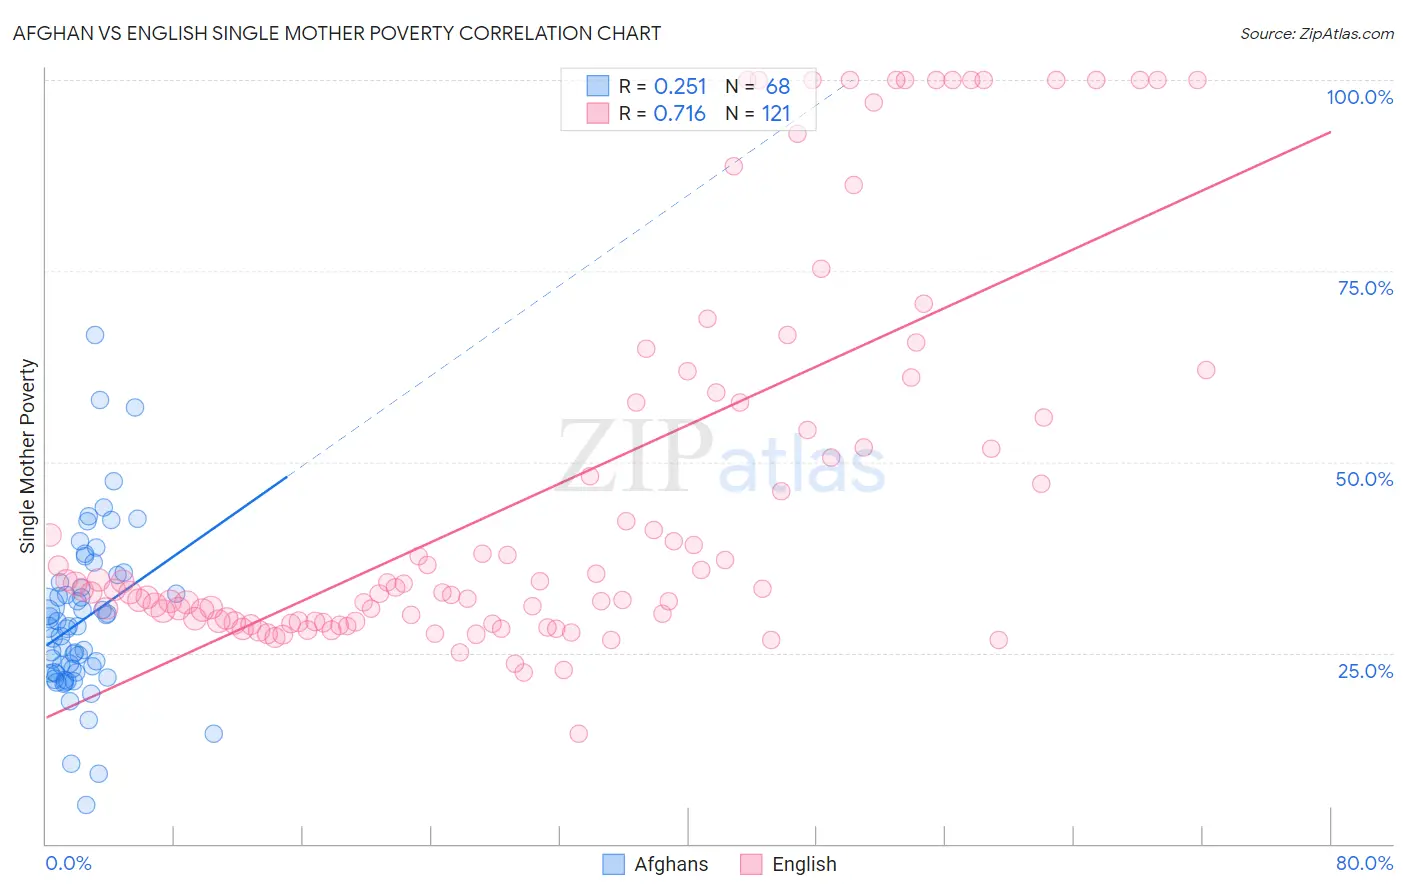
Afghan vs English Single Mother Poverty Correlation Chart
The statistical analysis conducted on geographies consisting of 147,050,043 people shows a weak positive correlation between the proportion of Afghans and poverty level among single mothers in the United States with a correlation coefficient (R) of 0.251 and weighted average of 27.7%. Similarly, the statistical analysis conducted on geographies consisting of 548,772,059 people shows a strong positive correlation between the proportion of English and poverty level among single mothers in the United States with a correlation coefficient (R) of 0.716 and weighted average of 30.2%, a difference of 9.0%.
Single Mother Poverty Correlation Summary
| Measurement | Afghan | English |
| Minimum | 5.1% | 14.4% |
| Maximum | 66.7% | 100.0% |
| Range | 61.5% | 85.6% |
| Mean | 29.3% | 46.2% |
| Median | 28.2% | 33.3% |
| Interquartile 25% (IQ1) | 22.4% | 29.1% |
| Interquartile 75% (IQ3) | 33.9% | 57.7% |
| Interquartile Range (IQR) | 11.6% | 28.6% |
| Standard Deviation (Sample) | 10.8% | 25.2% |
| Standard Deviation (Population) | 10.7% | 25.1% |
Similar Demographics by Single Mother Poverty
Demographics Similar to Afghans by Single Mother Poverty
In terms of single mother poverty, the demographic groups most similar to Afghans are Ethiopian (27.7%, a difference of 0.020%), Immigrants from Ethiopia (27.7%, a difference of 0.040%), Immigrants from Ukraine (27.7%, a difference of 0.10%), Mongolian (27.7%, a difference of 0.19%), and Immigrants from Latvia (27.7%, a difference of 0.20%).
| Demographics | Rating | Rank | Single Mother Poverty |
| Taiwanese | 99.1 /100 | #80 | Exceptional 27.5% |
| Immigrants | Scotland | 98.9 /100 | #81 | Exceptional 27.6% |
| Immigrants | Cameroon | 98.8 /100 | #82 | Exceptional 27.6% |
| Greeks | 98.7 /100 | #83 | Exceptional 27.7% |
| Immigrants | Latvia | 98.7 /100 | #84 | Exceptional 27.7% |
| Mongolians | 98.7 /100 | #85 | Exceptional 27.7% |
| Immigrants | Ukraine | 98.6 /100 | #86 | Exceptional 27.7% |
| Afghans | 98.5 /100 | #87 | Exceptional 27.7% |
| Ethiopians | 98.4 /100 | #88 | Exceptional 27.7% |
| Immigrants | Ethiopia | 98.4 /100 | #89 | Exceptional 27.7% |
| Immigrants | France | 98.2 /100 | #90 | Exceptional 27.8% |
| Immigrants | Albania | 98.0 /100 | #91 | Exceptional 27.8% |
| Estonians | 97.9 /100 | #92 | Exceptional 27.8% |
| Romanians | 97.8 /100 | #93 | Exceptional 27.8% |
| Albanians | 97.6 /100 | #94 | Exceptional 27.9% |
Demographics Similar to English by Single Mother Poverty
In terms of single mother poverty, the demographic groups most similar to English are Immigrants from Barbados (30.2%, a difference of 0.040%), Spaniard (30.2%, a difference of 0.13%), Dutch (30.2%, a difference of 0.15%), Alaskan Athabascan (30.3%, a difference of 0.19%), and Immigrants from Liberia (30.1%, a difference of 0.25%).
| Demographics | Rating | Rank | Single Mother Poverty |
| Immigrants | Cuba | 6.9 /100 | #223 | Tragic 30.1% |
| Immigrants | Sudan | 6.5 /100 | #224 | Tragic 30.1% |
| Spanish | 6.3 /100 | #225 | Tragic 30.1% |
| Scottish | 6.0 /100 | #226 | Tragic 30.1% |
| Immigrants | Liberia | 5.9 /100 | #227 | Tragic 30.1% |
| Spaniards | 5.4 /100 | #228 | Tragic 30.2% |
| Immigrants | Barbados | 5.0 /100 | #229 | Tragic 30.2% |
| English | 4.8 /100 | #230 | Tragic 30.2% |
| Dutch | 4.3 /100 | #231 | Tragic 30.2% |
| Alaskan Athabascans | 4.1 /100 | #232 | Tragic 30.3% |
| Immigrants | Middle Africa | 3.5 /100 | #233 | Tragic 30.3% |
| Immigrants | Nicaragua | 3.5 /100 | #234 | Tragic 30.3% |
| Immigrants | Grenada | 3.4 /100 | #235 | Tragic 30.3% |
| Welsh | 3.2 /100 | #236 | Tragic 30.4% |
| Immigrants | St. Vincent and the Grenadines | 3.1 /100 | #237 | Tragic 30.4% |