Afghan vs Burmese Disability Age 65 to 74
COMPARE
Afghan
Burmese
Disability Age 65 to 74
Disability Age 65 to 74 Comparison
Afghans
Burmese
22.6%
DISABILITY AGE 65 TO 74
88.6/ 100
METRIC RATING
134th/ 347
METRIC RANK
20.6%
DISABILITY AGE 65 TO 74
100.0/ 100
METRIC RATING
19th/ 347
METRIC RANK
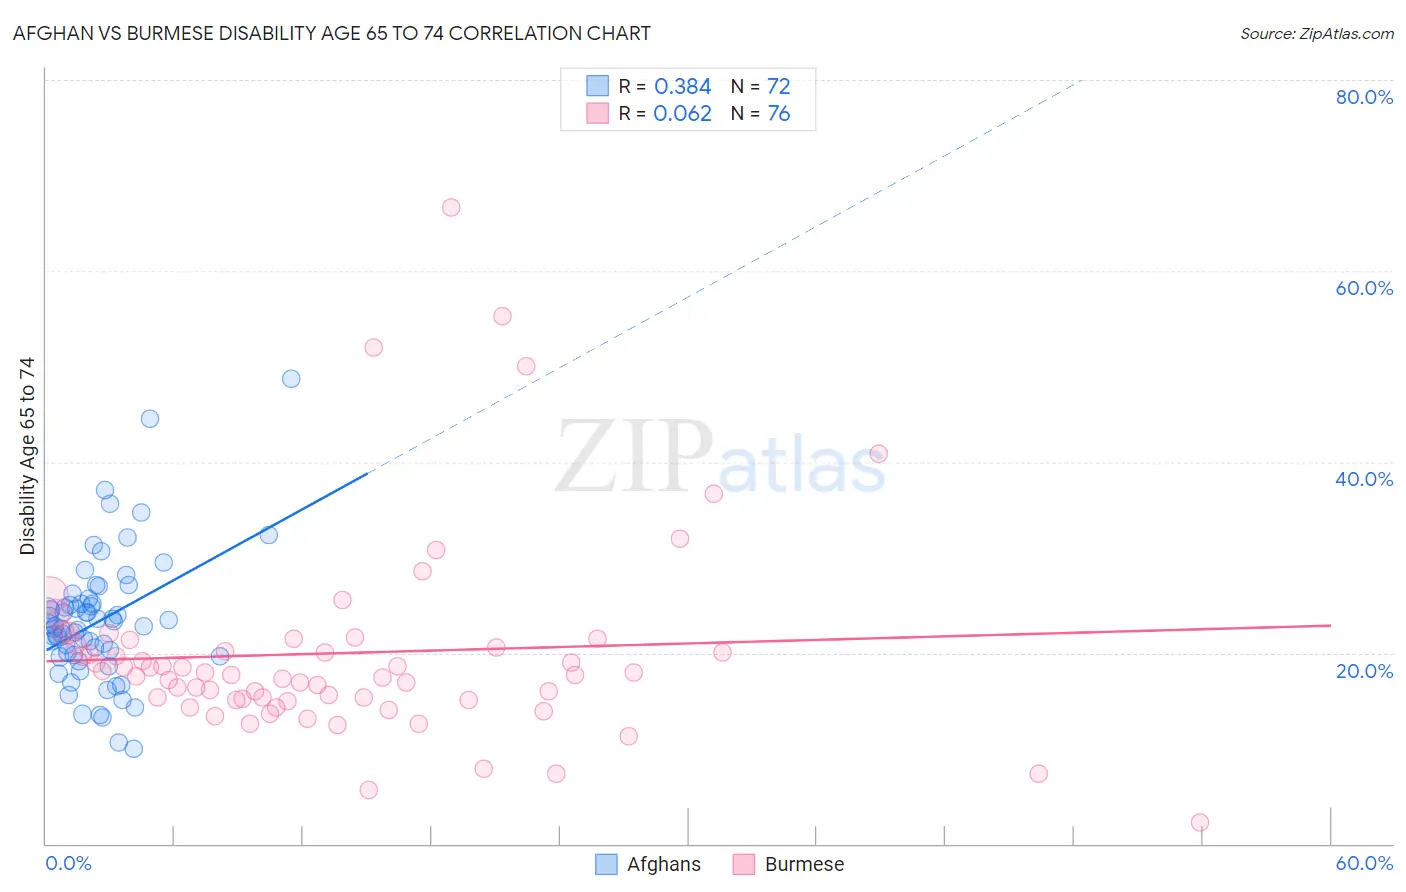
Afghan vs Burmese Disability Age 65 to 74 Correlation Chart
The statistical analysis conducted on geographies consisting of 148,797,358 people shows a mild positive correlation between the proportion of Afghans and percentage of population with a disability between the ages 65 and 75 in the United States with a correlation coefficient (R) of 0.384 and weighted average of 22.6%. Similarly, the statistical analysis conducted on geographies consisting of 463,915,449 people shows a slight positive correlation between the proportion of Burmese and percentage of population with a disability between the ages 65 and 75 in the United States with a correlation coefficient (R) of 0.062 and weighted average of 20.6%, a difference of 9.8%.
Disability Age 65 to 74 Correlation Summary
| Measurement | Afghan | Burmese |
| Minimum | 10.0% | 2.2% |
| Maximum | 48.7% | 66.7% |
| Range | 38.7% | 64.5% |
| Mean | 23.3% | 20.0% |
| Median | 22.8% | 17.8% |
| Interquartile 25% (IQ1) | 19.7% | 15.2% |
| Interquartile 75% (IQ3) | 25.1% | 21.1% |
| Interquartile Range (IQR) | 5.4% | 5.9% |
| Standard Deviation (Sample) | 6.7% | 10.6% |
| Standard Deviation (Population) | 6.7% | 10.5% |
Similar Demographics by Disability Age 65 to 74
Demographics Similar to Afghans by Disability Age 65 to 74
In terms of disability age 65 to 74, the demographic groups most similar to Afghans are Immigrants from Ukraine (22.6%, a difference of 0.030%), Northern European (22.6%, a difference of 0.050%), Costa Rican (22.6%, a difference of 0.10%), Ethiopian (22.7%, a difference of 0.10%), and Immigrants from Nepal (22.6%, a difference of 0.13%).
| Demographics | Rating | Rank | Disability Age 65 to 74 |
| Slovaks | 91.6 /100 | #127 | Exceptional 22.5% |
| Immigrants | Costa Rica | 90.4 /100 | #128 | Exceptional 22.6% |
| Immigrants | Uruguay | 90.1 /100 | #129 | Exceptional 22.6% |
| Immigrants | Albania | 90.0 /100 | #130 | Excellent 22.6% |
| Immigrants | Nepal | 89.4 /100 | #131 | Excellent 22.6% |
| Costa Ricans | 89.2 /100 | #132 | Excellent 22.6% |
| Northern Europeans | 88.9 /100 | #133 | Excellent 22.6% |
| Afghans | 88.6 /100 | #134 | Excellent 22.6% |
| Immigrants | Ukraine | 88.4 /100 | #135 | Excellent 22.6% |
| Ethiopians | 87.9 /100 | #136 | Excellent 22.7% |
| Taiwanese | 87.6 /100 | #137 | Excellent 22.7% |
| Immigrants | Moldova | 87.3 /100 | #138 | Excellent 22.7% |
| Immigrants | Syria | 85.8 /100 | #139 | Excellent 22.7% |
| Ugandans | 85.4 /100 | #140 | Excellent 22.7% |
| Belgians | 85.3 /100 | #141 | Excellent 22.7% |
Demographics Similar to Burmese by Disability Age 65 to 74
In terms of disability age 65 to 74, the demographic groups most similar to Burmese are Eastern European (20.6%, a difference of 0.030%), Immigrants from South Central Asia (20.6%, a difference of 0.10%), Okinawan (20.7%, a difference of 0.32%), Immigrants from Lithuania (20.5%, a difference of 0.35%), and Paraguayan (20.5%, a difference of 0.41%).
| Demographics | Rating | Rank | Disability Age 65 to 74 |
| Immigrants | Korea | 100.0 /100 | #12 | Exceptional 20.4% |
| Immigrants | Singapore | 100.0 /100 | #13 | Exceptional 20.4% |
| Indians (Asian) | 100.0 /100 | #14 | Exceptional 20.5% |
| Paraguayans | 100.0 /100 | #15 | Exceptional 20.5% |
| Immigrants | Lithuania | 100.0 /100 | #16 | Exceptional 20.5% |
| Immigrants | South Central Asia | 100.0 /100 | #17 | Exceptional 20.6% |
| Eastern Europeans | 100.0 /100 | #18 | Exceptional 20.6% |
| Burmese | 100.0 /100 | #19 | Exceptional 20.6% |
| Okinawans | 100.0 /100 | #20 | Exceptional 20.7% |
| Immigrants | Bolivia | 99.9 /100 | #21 | Exceptional 20.8% |
| Immigrants | Iran | 99.9 /100 | #22 | Exceptional 20.9% |
| Immigrants | Belgium | 99.9 /100 | #23 | Exceptional 21.0% |
| Soviet Union | 99.9 /100 | #24 | Exceptional 21.0% |
| Bolivians | 99.9 /100 | #25 | Exceptional 21.0% |
| Immigrants | Australia | 99.9 /100 | #26 | Exceptional 21.0% |