Afghan vs Immigrants from Grenada Single Mother Poverty
COMPARE
Afghan
Immigrants from Grenada
Single Mother Poverty
Single Mother Poverty Comparison
Afghans
Immigrants from Grenada
27.7%
SINGLE MOTHER POVERTY
98.5/ 100
METRIC RATING
87th/ 347
METRIC RANK
30.3%
SINGLE MOTHER POVERTY
3.4/ 100
METRIC RATING
235th/ 347
METRIC RANK
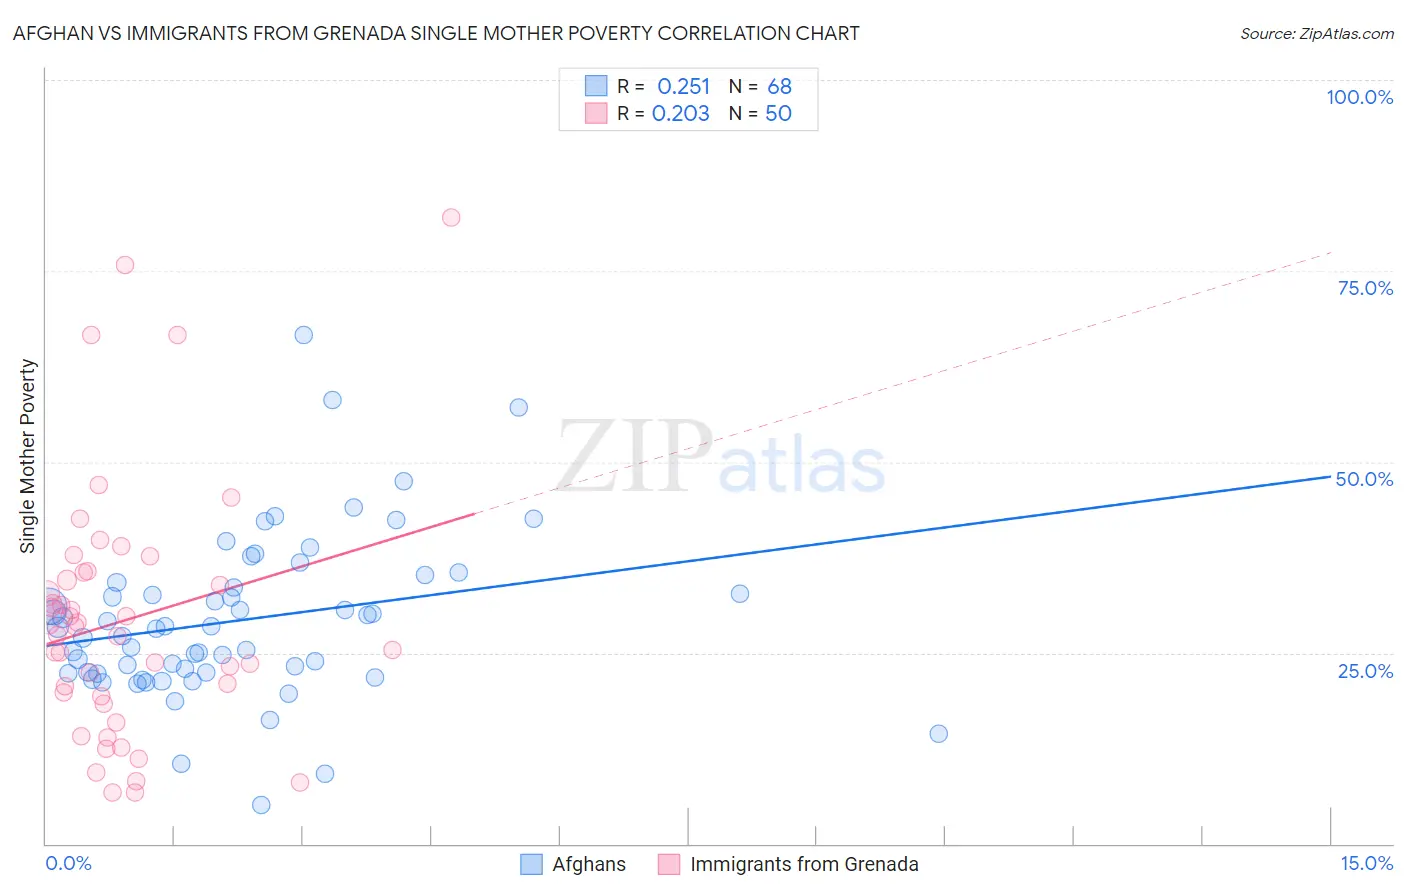
Afghan vs Immigrants from Grenada Single Mother Poverty Correlation Chart
The statistical analysis conducted on geographies consisting of 147,050,043 people shows a weak positive correlation between the proportion of Afghans and poverty level among single mothers in the United States with a correlation coefficient (R) of 0.251 and weighted average of 27.7%. Similarly, the statistical analysis conducted on geographies consisting of 66,826,476 people shows a weak positive correlation between the proportion of Immigrants from Grenada and poverty level among single mothers in the United States with a correlation coefficient (R) of 0.203 and weighted average of 30.3%, a difference of 9.4%.
Single Mother Poverty Correlation Summary
| Measurement | Afghan | Immigrants from Grenada |
| Minimum | 5.1% | 6.6% |
| Maximum | 66.7% | 82.1% |
| Range | 61.5% | 75.4% |
| Mean | 29.3% | 29.3% |
| Median | 28.2% | 27.9% |
| Interquartile 25% (IQ1) | 22.4% | 19.2% |
| Interquartile 75% (IQ3) | 33.9% | 35.5% |
| Interquartile Range (IQR) | 11.6% | 16.3% |
| Standard Deviation (Sample) | 10.8% | 16.6% |
| Standard Deviation (Population) | 10.7% | 16.4% |
Similar Demographics by Single Mother Poverty
Demographics Similar to Afghans by Single Mother Poverty
In terms of single mother poverty, the demographic groups most similar to Afghans are Ethiopian (27.7%, a difference of 0.020%), Immigrants from Ethiopia (27.7%, a difference of 0.040%), Immigrants from Ukraine (27.7%, a difference of 0.10%), Mongolian (27.7%, a difference of 0.19%), and Immigrants from Latvia (27.7%, a difference of 0.20%).
| Demographics | Rating | Rank | Single Mother Poverty |
| Taiwanese | 99.1 /100 | #80 | Exceptional 27.5% |
| Immigrants | Scotland | 98.9 /100 | #81 | Exceptional 27.6% |
| Immigrants | Cameroon | 98.8 /100 | #82 | Exceptional 27.6% |
| Greeks | 98.7 /100 | #83 | Exceptional 27.7% |
| Immigrants | Latvia | 98.7 /100 | #84 | Exceptional 27.7% |
| Mongolians | 98.7 /100 | #85 | Exceptional 27.7% |
| Immigrants | Ukraine | 98.6 /100 | #86 | Exceptional 27.7% |
| Afghans | 98.5 /100 | #87 | Exceptional 27.7% |
| Ethiopians | 98.4 /100 | #88 | Exceptional 27.7% |
| Immigrants | Ethiopia | 98.4 /100 | #89 | Exceptional 27.7% |
| Immigrants | France | 98.2 /100 | #90 | Exceptional 27.8% |
| Immigrants | Albania | 98.0 /100 | #91 | Exceptional 27.8% |
| Estonians | 97.9 /100 | #92 | Exceptional 27.8% |
| Romanians | 97.8 /100 | #93 | Exceptional 27.8% |
| Albanians | 97.6 /100 | #94 | Exceptional 27.9% |
Demographics Similar to Immigrants from Grenada by Single Mother Poverty
In terms of single mother poverty, the demographic groups most similar to Immigrants from Grenada are Immigrants from Middle Africa (30.3%, a difference of 0.030%), Immigrants from Nicaragua (30.3%, a difference of 0.030%), Welsh (30.4%, a difference of 0.070%), Immigrants from St. Vincent and the Grenadines (30.4%, a difference of 0.12%), and Slovak (30.4%, a difference of 0.23%).
| Demographics | Rating | Rank | Single Mother Poverty |
| Spaniards | 5.4 /100 | #228 | Tragic 30.2% |
| Immigrants | Barbados | 5.0 /100 | #229 | Tragic 30.2% |
| English | 4.8 /100 | #230 | Tragic 30.2% |
| Dutch | 4.3 /100 | #231 | Tragic 30.2% |
| Alaskan Athabascans | 4.1 /100 | #232 | Tragic 30.3% |
| Immigrants | Middle Africa | 3.5 /100 | #233 | Tragic 30.3% |
| Immigrants | Nicaragua | 3.5 /100 | #234 | Tragic 30.3% |
| Immigrants | Grenada | 3.4 /100 | #235 | Tragic 30.3% |
| Welsh | 3.2 /100 | #236 | Tragic 30.4% |
| Immigrants | St. Vincent and the Grenadines | 3.1 /100 | #237 | Tragic 30.4% |
| Slovaks | 2.8 /100 | #238 | Tragic 30.4% |
| Immigrants | Portugal | 2.1 /100 | #239 | Tragic 30.5% |
| Salvadorans | 1.8 /100 | #240 | Tragic 30.6% |
| Immigrants | Laos | 1.8 /100 | #241 | Tragic 30.6% |
| Immigrants | Burma/Myanmar | 1.7 /100 | #242 | Tragic 30.6% |