Indian (Asian) vs Immigrants from Colombia In Labor Force | Age 20-24
COMPARE
Indian (Asian)
Immigrants from Colombia
In Labor Force | Age 20-24
In Labor Force | Age 20-24 Comparison
Indians (Asian)
Immigrants from Colombia
71.9%
IN LABOR FORCE | AGE 20-24
0.0/ 100
METRIC RATING
314th/ 347
METRIC RANK
73.4%
IN LABOR FORCE | AGE 20-24
0.2/ 100
METRIC RATING
274th/ 347
METRIC RANK
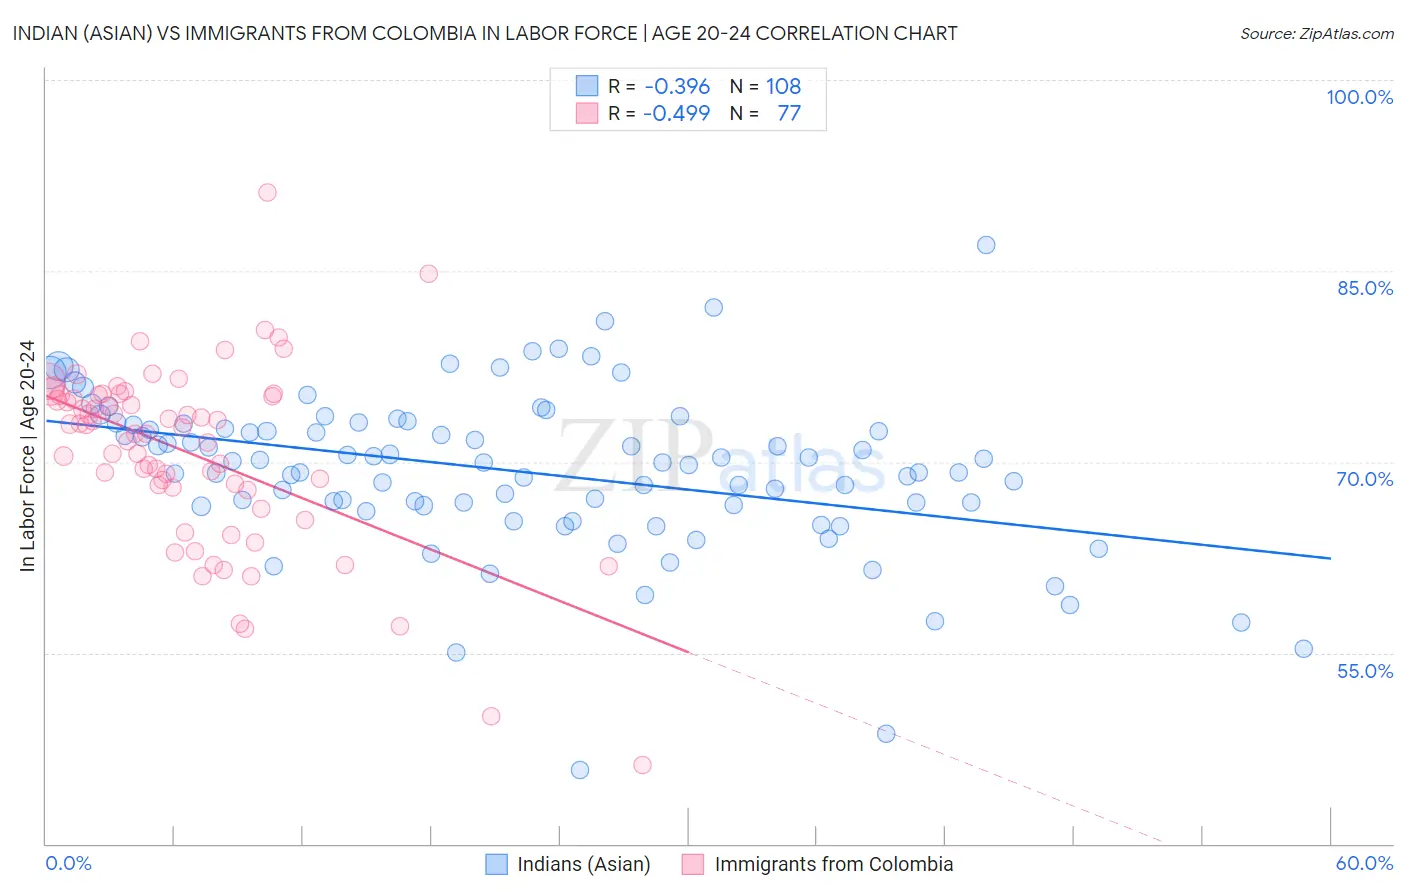
Indian (Asian) vs Immigrants from Colombia In Labor Force | Age 20-24 Correlation Chart
The statistical analysis conducted on geographies consisting of 495,002,226 people shows a mild negative correlation between the proportion of Indians (Asian) and labor force participation rate among population between the ages 20 and 24 in the United States with a correlation coefficient (R) of -0.396 and weighted average of 71.9%. Similarly, the statistical analysis conducted on geographies consisting of 378,565,425 people shows a moderate negative correlation between the proportion of Immigrants from Colombia and labor force participation rate among population between the ages 20 and 24 in the United States with a correlation coefficient (R) of -0.499 and weighted average of 73.4%, a difference of 2.1%.
In Labor Force | Age 20-24 Correlation Summary
| Measurement | Indian (Asian) | Immigrants from Colombia |
| Minimum | 45.8% | 46.2% |
| Maximum | 87.0% | 91.2% |
| Range | 41.2% | 45.0% |
| Mean | 69.2% | 70.7% |
| Median | 70.0% | 72.7% |
| Interquartile 25% (IQ1) | 66.6% | 67.9% |
| Interquartile 75% (IQ3) | 72.9% | 75.2% |
| Interquartile Range (IQR) | 6.4% | 7.3% |
| Standard Deviation (Sample) | 6.3% | 7.3% |
| Standard Deviation (Population) | 6.3% | 7.2% |
Similar Demographics by In Labor Force | Age 20-24
Demographics Similar to Indians (Asian) by In Labor Force | Age 20-24
In terms of in labor force | age 20-24, the demographic groups most similar to Indians (Asian) are Immigrants from Dominica (71.9%, a difference of 0.010%), Immigrants from Caribbean (71.9%, a difference of 0.060%), Immigrants from Iran (71.8%, a difference of 0.090%), Apache (72.0%, a difference of 0.13%), and Immigrants from Eastern Asia (71.8%, a difference of 0.13%).
| Demographics | Rating | Rank | In Labor Force | Age 20-24 |
| Immigrants | Ecuador | 0.0 /100 | #307 | Tragic 72.3% |
| Soviet Union | 0.0 /100 | #308 | Tragic 72.3% |
| Tsimshian | 0.0 /100 | #309 | Tragic 72.3% |
| Immigrants | Cuba | 0.0 /100 | #310 | Tragic 72.0% |
| Apache | 0.0 /100 | #311 | Tragic 72.0% |
| Immigrants | Caribbean | 0.0 /100 | #312 | Tragic 71.9% |
| Immigrants | Dominica | 0.0 /100 | #313 | Tragic 71.9% |
| Indians (Asian) | 0.0 /100 | #314 | Tragic 71.9% |
| Immigrants | Iran | 0.0 /100 | #315 | Tragic 71.8% |
| Immigrants | Eastern Asia | 0.0 /100 | #316 | Tragic 71.8% |
| Immigrants | Armenia | 0.0 /100 | #317 | Tragic 71.7% |
| Immigrants | Hong Kong | 0.0 /100 | #318 | Tragic 71.6% |
| Immigrants | Israel | 0.0 /100 | #319 | Tragic 71.6% |
| Trinidadians and Tobagonians | 0.0 /100 | #320 | Tragic 71.5% |
| Immigrants | Taiwan | 0.0 /100 | #321 | Tragic 71.5% |
Demographics Similar to Immigrants from Colombia by In Labor Force | Age 20-24
In terms of in labor force | age 20-24, the demographic groups most similar to Immigrants from Colombia are Cheyenne (73.4%, a difference of 0.020%), Belizean (73.4%, a difference of 0.050%), Immigrants from South America (73.3%, a difference of 0.050%), Immigrants from Indonesia (73.4%, a difference of 0.060%), and Mongolian (73.3%, a difference of 0.070%).
| Demographics | Rating | Rank | In Labor Force | Age 20-24 |
| Immigrants | Western Asia | 0.4 /100 | #267 | Tragic 73.5% |
| South Americans | 0.4 /100 | #268 | Tragic 73.5% |
| Colombians | 0.3 /100 | #269 | Tragic 73.5% |
| Immigrants | Russia | 0.3 /100 | #270 | Tragic 73.5% |
| Immigrants | Indonesia | 0.3 /100 | #271 | Tragic 73.4% |
| Belizeans | 0.3 /100 | #272 | Tragic 73.4% |
| Cheyenne | 0.2 /100 | #273 | Tragic 73.4% |
| Immigrants | Colombia | 0.2 /100 | #274 | Tragic 73.4% |
| Immigrants | South America | 0.2 /100 | #275 | Tragic 73.3% |
| Mongolians | 0.2 /100 | #276 | Tragic 73.3% |
| Immigrants | Malaysia | 0.2 /100 | #277 | Tragic 73.3% |
| Cypriots | 0.2 /100 | #278 | Tragic 73.3% |
| Venezuelans | 0.2 /100 | #279 | Tragic 73.3% |
| Bahamians | 0.1 /100 | #280 | Tragic 73.3% |
| Immigrants | Venezuela | 0.1 /100 | #281 | Tragic 73.2% |