Indian (Asian) vs Immigrants from Croatia In Labor Force | Age 20-24
COMPARE
Indian (Asian)
Immigrants from Croatia
In Labor Force | Age 20-24
In Labor Force | Age 20-24 Comparison
Indians (Asian)
Immigrants from Croatia
71.9%
IN LABOR FORCE | AGE 20-24
0.0/ 100
METRIC RATING
314th/ 347
METRIC RANK
75.1%
IN LABOR FORCE | AGE 20-24
50.2/ 100
METRIC RATING
173rd/ 347
METRIC RANK
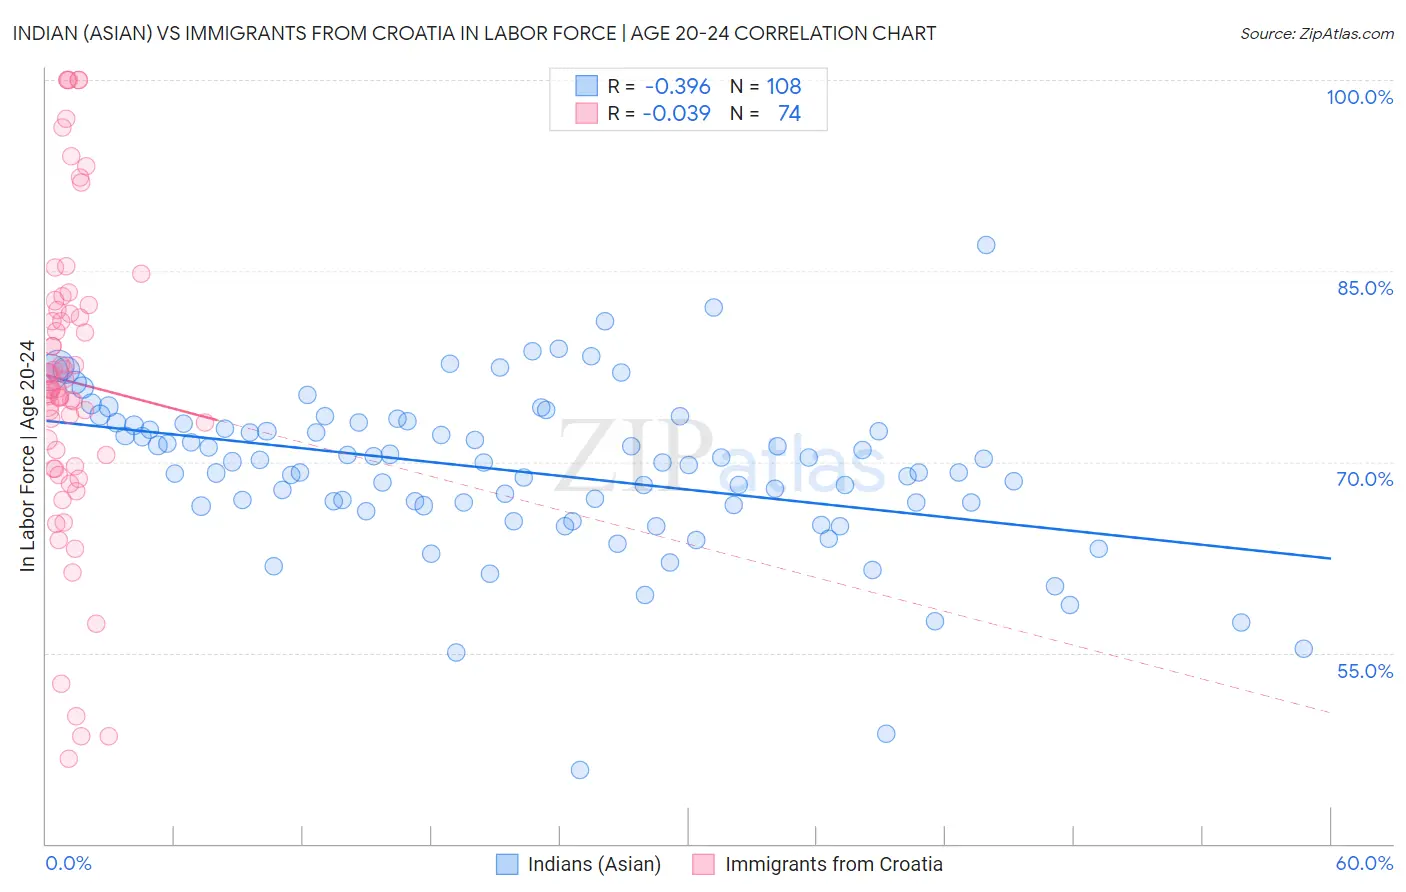
Indian (Asian) vs Immigrants from Croatia In Labor Force | Age 20-24 Correlation Chart
The statistical analysis conducted on geographies consisting of 495,002,226 people shows a mild negative correlation between the proportion of Indians (Asian) and labor force participation rate among population between the ages 20 and 24 in the United States with a correlation coefficient (R) of -0.396 and weighted average of 71.9%. Similarly, the statistical analysis conducted on geographies consisting of 132,557,880 people shows no correlation between the proportion of Immigrants from Croatia and labor force participation rate among population between the ages 20 and 24 in the United States with a correlation coefficient (R) of -0.039 and weighted average of 75.1%, a difference of 4.4%.
In Labor Force | Age 20-24 Correlation Summary
| Measurement | Indian (Asian) | Immigrants from Croatia |
| Minimum | 45.8% | 46.7% |
| Maximum | 87.0% | 100.0% |
| Range | 41.2% | 53.3% |
| Mean | 69.2% | 76.4% |
| Median | 70.0% | 75.7% |
| Interquartile 25% (IQ1) | 66.6% | 69.7% |
| Interquartile 75% (IQ3) | 72.9% | 81.9% |
| Interquartile Range (IQR) | 6.4% | 12.2% |
| Standard Deviation (Sample) | 6.3% | 12.1% |
| Standard Deviation (Population) | 6.3% | 12.1% |
Similar Demographics by In Labor Force | Age 20-24
Demographics Similar to Indians (Asian) by In Labor Force | Age 20-24
In terms of in labor force | age 20-24, the demographic groups most similar to Indians (Asian) are Immigrants from Dominica (71.9%, a difference of 0.010%), Immigrants from Caribbean (71.9%, a difference of 0.060%), Immigrants from Iran (71.8%, a difference of 0.090%), Apache (72.0%, a difference of 0.13%), and Immigrants from Eastern Asia (71.8%, a difference of 0.13%).
| Demographics | Rating | Rank | In Labor Force | Age 20-24 |
| Immigrants | Ecuador | 0.0 /100 | #307 | Tragic 72.3% |
| Soviet Union | 0.0 /100 | #308 | Tragic 72.3% |
| Tsimshian | 0.0 /100 | #309 | Tragic 72.3% |
| Immigrants | Cuba | 0.0 /100 | #310 | Tragic 72.0% |
| Apache | 0.0 /100 | #311 | Tragic 72.0% |
| Immigrants | Caribbean | 0.0 /100 | #312 | Tragic 71.9% |
| Immigrants | Dominica | 0.0 /100 | #313 | Tragic 71.9% |
| Indians (Asian) | 0.0 /100 | #314 | Tragic 71.9% |
| Immigrants | Iran | 0.0 /100 | #315 | Tragic 71.8% |
| Immigrants | Eastern Asia | 0.0 /100 | #316 | Tragic 71.8% |
| Immigrants | Armenia | 0.0 /100 | #317 | Tragic 71.7% |
| Immigrants | Hong Kong | 0.0 /100 | #318 | Tragic 71.6% |
| Immigrants | Israel | 0.0 /100 | #319 | Tragic 71.6% |
| Trinidadians and Tobagonians | 0.0 /100 | #320 | Tragic 71.5% |
| Immigrants | Taiwan | 0.0 /100 | #321 | Tragic 71.5% |
Demographics Similar to Immigrants from Croatia by In Labor Force | Age 20-24
In terms of in labor force | age 20-24, the demographic groups most similar to Immigrants from Croatia are South African (75.0%, a difference of 0.0%), Cajun (75.1%, a difference of 0.010%), Yakama (75.1%, a difference of 0.010%), Syrian (75.0%, a difference of 0.010%), and Central American (75.0%, a difference of 0.020%).
| Demographics | Rating | Rank | In Labor Force | Age 20-24 |
| Cambodians | 60.5 /100 | #166 | Good 75.2% |
| Immigrants | South Eastern Asia | 57.5 /100 | #167 | Average 75.1% |
| Immigrants | Western Africa | 56.7 /100 | #168 | Average 75.1% |
| Immigrants | Philippines | 55.8 /100 | #169 | Average 75.1% |
| Mexicans | 52.1 /100 | #170 | Average 75.1% |
| Cajuns | 51.1 /100 | #171 | Average 75.1% |
| Yakama | 50.8 /100 | #172 | Average 75.1% |
| Immigrants | Croatia | 50.2 /100 | #173 | Average 75.1% |
| South Africans | 50.0 /100 | #174 | Average 75.0% |
| Syrians | 49.5 /100 | #175 | Average 75.0% |
| Central Americans | 48.7 /100 | #176 | Average 75.0% |
| Immigrants | Mexico | 47.8 /100 | #177 | Average 75.0% |
| Immigrants | Central America | 45.0 /100 | #178 | Average 75.0% |
| Immigrants | Latvia | 44.1 /100 | #179 | Average 75.0% |
| Immigrants | Czechoslovakia | 44.0 /100 | #180 | Average 75.0% |