Yup'ik vs Immigrants from Philippines In Labor Force | Age 30-34
COMPARE
Yup'ik
Immigrants from Philippines
In Labor Force | Age 30-34
In Labor Force | Age 30-34 Comparison
Yup'ik
Immigrants from Philippines
76.4%
IN LABOR FORCE | AGE 30-34
0.0/ 100
METRIC RATING
345th/ 347
METRIC RANK
84.6%
IN LABOR FORCE | AGE 30-34
31.5/ 100
METRIC RATING
185th/ 347
METRIC RANK
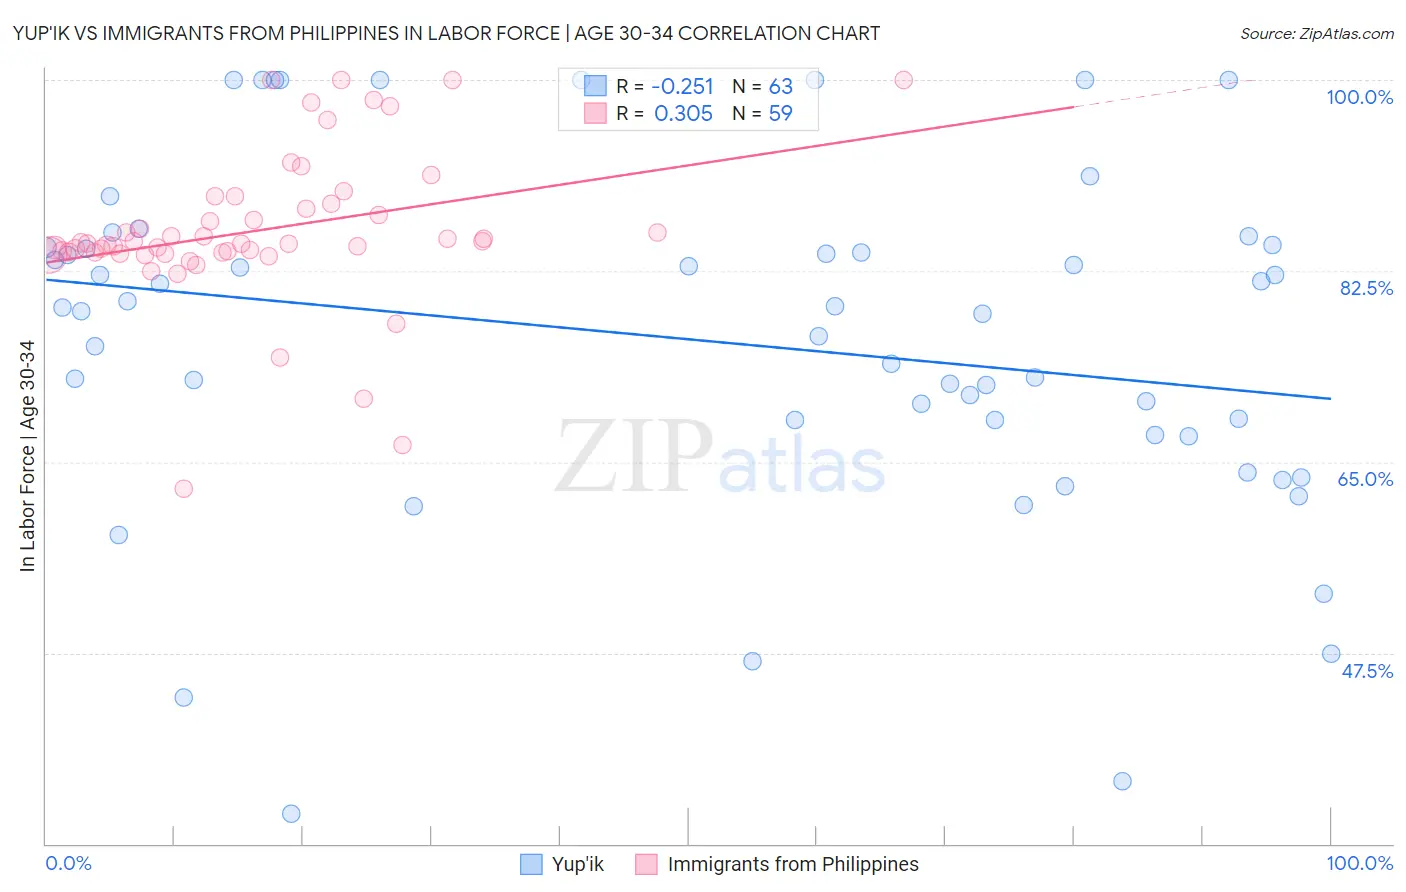
Yup'ik vs Immigrants from Philippines In Labor Force | Age 30-34 Correlation Chart
The statistical analysis conducted on geographies consisting of 39,955,803 people shows a weak negative correlation between the proportion of Yup'ik and labor force participation rate among population between the ages 30 and 34 in the United States with a correlation coefficient (R) of -0.251 and weighted average of 76.4%. Similarly, the statistical analysis conducted on geographies consisting of 471,048,330 people shows a mild positive correlation between the proportion of Immigrants from Philippines and labor force participation rate among population between the ages 30 and 34 in the United States with a correlation coefficient (R) of 0.305 and weighted average of 84.6%, a difference of 10.6%.
In Labor Force | Age 30-34 Correlation Summary
| Measurement | Yup'ik | Immigrants from Philippines |
| Minimum | 32.8% | 62.5% |
| Maximum | 100.0% | 100.0% |
| Range | 67.2% | 37.5% |
| Mean | 76.1% | 86.2% |
| Median | 78.8% | 85.0% |
| Interquartile 25% (IQ1) | 67.5% | 84.2% |
| Interquartile 75% (IQ3) | 84.7% | 88.7% |
| Interquartile Range (IQR) | 17.2% | 4.5% |
| Standard Deviation (Sample) | 15.8% | 7.1% |
| Standard Deviation (Population) | 15.7% | 7.1% |
Similar Demographics by In Labor Force | Age 30-34
Demographics Similar to Yup'ik by In Labor Force | Age 30-34
In terms of in labor force | age 30-34, the demographic groups most similar to Yup'ik are Crow (75.9%, a difference of 0.68%), Yuman (77.1%, a difference of 0.87%), Lumbee (77.3%, a difference of 1.1%), Tohono O'odham (77.7%, a difference of 1.7%), and Immigrants from Yemen (78.2%, a difference of 2.3%).
| Demographics | Rating | Rank | In Labor Force | Age 30-34 |
| Inupiat | 0.0 /100 | #333 | Tragic 79.7% |
| Hopi | 0.0 /100 | #334 | Tragic 79.3% |
| Marshallese | 0.0 /100 | #335 | Tragic 79.2% |
| Natives/Alaskans | 0.0 /100 | #336 | Tragic 79.2% |
| Yakama | 0.0 /100 | #337 | Tragic 79.1% |
| Pima | 0.0 /100 | #338 | Tragic 79.0% |
| Apache | 0.0 /100 | #339 | Tragic 79.0% |
| Ute | 0.0 /100 | #340 | Tragic 78.9% |
| Immigrants | Yemen | 0.0 /100 | #341 | Tragic 78.2% |
| Tohono O'odham | 0.0 /100 | #342 | Tragic 77.7% |
| Lumbee | 0.0 /100 | #343 | Tragic 77.3% |
| Yuman | 0.0 /100 | #344 | Tragic 77.1% |
| Yup'ik | 0.0 /100 | #345 | Tragic 76.4% |
| Crow | 0.0 /100 | #346 | Tragic 75.9% |
| Navajo | 0.0 /100 | #347 | Tragic 73.8% |
Demographics Similar to Immigrants from Philippines by In Labor Force | Age 30-34
In terms of in labor force | age 30-34, the demographic groups most similar to Immigrants from Philippines are Immigrants from North America (84.6%, a difference of 0.010%), Immigrants from Congo (84.6%, a difference of 0.010%), Costa Rican (84.6%, a difference of 0.020%), Taiwanese (84.6%, a difference of 0.020%), and Nigerian (84.5%, a difference of 0.020%).
| Demographics | Rating | Rank | In Labor Force | Age 30-34 |
| Okinawans | 44.1 /100 | #178 | Average 84.6% |
| Immigrants | Nigeria | 42.5 /100 | #179 | Average 84.6% |
| Immigrants | Netherlands | 42.1 /100 | #180 | Average 84.6% |
| Moroccans | 40.3 /100 | #181 | Average 84.6% |
| Barbadians | 36.7 /100 | #182 | Fair 84.6% |
| Immigrants | Canada | 35.0 /100 | #183 | Fair 84.6% |
| Immigrants | North America | 33.3 /100 | #184 | Fair 84.6% |
| Immigrants | Philippines | 31.5 /100 | #185 | Fair 84.6% |
| Immigrants | Congo | 29.7 /100 | #186 | Fair 84.6% |
| Costa Ricans | 29.6 /100 | #187 | Fair 84.6% |
| Taiwanese | 29.4 /100 | #188 | Fair 84.6% |
| Nigerians | 28.9 /100 | #189 | Fair 84.5% |
| Immigrants | Zaire | 25.8 /100 | #190 | Fair 84.5% |
| Hungarians | 24.8 /100 | #191 | Fair 84.5% |
| Scandinavians | 24.7 /100 | #192 | Fair 84.5% |