Hmong vs Immigrants from Philippines In Labor Force | Age 30-34
COMPARE
Hmong
Immigrants from Philippines
In Labor Force | Age 30-34
In Labor Force | Age 30-34 Comparison
Hmong
Immigrants from Philippines
82.4%
IN LABOR FORCE | AGE 30-34
0.0/ 100
METRIC RATING
300th/ 347
METRIC RANK
84.6%
IN LABOR FORCE | AGE 30-34
31.5/ 100
METRIC RATING
185th/ 347
METRIC RANK
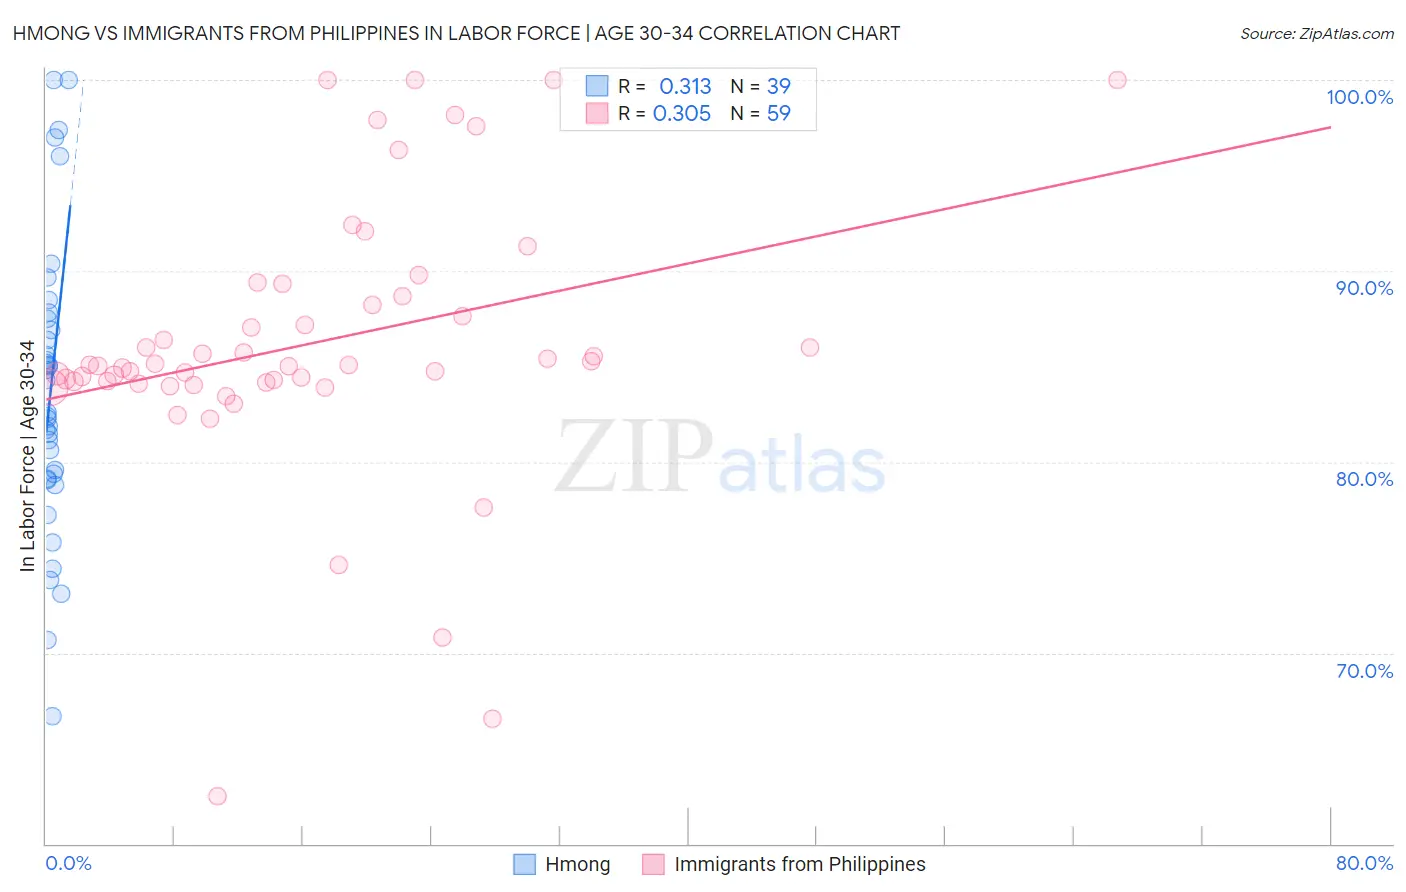
Hmong vs Immigrants from Philippines In Labor Force | Age 30-34 Correlation Chart
The statistical analysis conducted on geographies consisting of 24,678,157 people shows a mild positive correlation between the proportion of Hmong and labor force participation rate among population between the ages 30 and 34 in the United States with a correlation coefficient (R) of 0.313 and weighted average of 82.4%. Similarly, the statistical analysis conducted on geographies consisting of 471,048,330 people shows a mild positive correlation between the proportion of Immigrants from Philippines and labor force participation rate among population between the ages 30 and 34 in the United States with a correlation coefficient (R) of 0.305 and weighted average of 84.6%, a difference of 2.6%.
In Labor Force | Age 30-34 Correlation Summary
| Measurement | Hmong | Immigrants from Philippines |
| Minimum | 66.7% | 62.5% |
| Maximum | 100.0% | 100.0% |
| Range | 33.3% | 37.5% |
| Mean | 83.7% | 86.2% |
| Median | 82.6% | 85.0% |
| Interquartile 25% (IQ1) | 79.1% | 84.2% |
| Interquartile 75% (IQ3) | 87.5% | 88.7% |
| Interquartile Range (IQR) | 8.4% | 4.5% |
| Standard Deviation (Sample) | 7.6% | 7.1% |
| Standard Deviation (Population) | 7.5% | 7.1% |
Similar Demographics by In Labor Force | Age 30-34
Demographics Similar to Hmong by In Labor Force | Age 30-34
In terms of in labor force | age 30-34, the demographic groups most similar to Hmong are Hispanic or Latino (82.4%, a difference of 0.010%), Ottawa (82.4%, a difference of 0.040%), Immigrants from Micronesia (82.4%, a difference of 0.050%), Immigrants from Central America (82.5%, a difference of 0.060%), and Tlingit-Haida (82.3%, a difference of 0.13%).
| Demographics | Rating | Rank | In Labor Force | Age 30-34 |
| Nepalese | 0.0 /100 | #293 | Tragic 82.7% |
| Americans | 0.0 /100 | #294 | Tragic 82.7% |
| Pennsylvania Germans | 0.0 /100 | #295 | Tragic 82.6% |
| Chippewa | 0.0 /100 | #296 | Tragic 82.6% |
| Comanche | 0.0 /100 | #297 | Tragic 82.6% |
| Aleuts | 0.0 /100 | #298 | Tragic 82.6% |
| Immigrants | Central America | 0.0 /100 | #299 | Tragic 82.5% |
| Hmong | 0.0 /100 | #300 | Tragic 82.4% |
| Hispanics or Latinos | 0.0 /100 | #301 | Tragic 82.4% |
| Ottawa | 0.0 /100 | #302 | Tragic 82.4% |
| Immigrants | Micronesia | 0.0 /100 | #303 | Tragic 82.4% |
| Tlingit-Haida | 0.0 /100 | #304 | Tragic 82.3% |
| Osage | 0.0 /100 | #305 | Tragic 82.3% |
| Spanish American Indians | 0.0 /100 | #306 | Tragic 82.2% |
| Menominee | 0.0 /100 | #307 | Tragic 82.2% |
Demographics Similar to Immigrants from Philippines by In Labor Force | Age 30-34
In terms of in labor force | age 30-34, the demographic groups most similar to Immigrants from Philippines are Immigrants from North America (84.6%, a difference of 0.010%), Immigrants from Congo (84.6%, a difference of 0.010%), Costa Rican (84.6%, a difference of 0.020%), Taiwanese (84.6%, a difference of 0.020%), and Nigerian (84.5%, a difference of 0.020%).
| Demographics | Rating | Rank | In Labor Force | Age 30-34 |
| Okinawans | 44.1 /100 | #178 | Average 84.6% |
| Immigrants | Nigeria | 42.5 /100 | #179 | Average 84.6% |
| Immigrants | Netherlands | 42.1 /100 | #180 | Average 84.6% |
| Moroccans | 40.3 /100 | #181 | Average 84.6% |
| Barbadians | 36.7 /100 | #182 | Fair 84.6% |
| Immigrants | Canada | 35.0 /100 | #183 | Fair 84.6% |
| Immigrants | North America | 33.3 /100 | #184 | Fair 84.6% |
| Immigrants | Philippines | 31.5 /100 | #185 | Fair 84.6% |
| Immigrants | Congo | 29.7 /100 | #186 | Fair 84.6% |
| Costa Ricans | 29.6 /100 | #187 | Fair 84.6% |
| Taiwanese | 29.4 /100 | #188 | Fair 84.6% |
| Nigerians | 28.9 /100 | #189 | Fair 84.5% |
| Immigrants | Zaire | 25.8 /100 | #190 | Fair 84.5% |
| Hungarians | 24.8 /100 | #191 | Fair 84.5% |
| Scandinavians | 24.7 /100 | #192 | Fair 84.5% |