Yup'ik vs Immigrants from Philippines High School Diploma
COMPARE
Yup'ik
Immigrants from Philippines
High School Diploma
High School Diploma Comparison
Yup'ik
Immigrants from Philippines
86.1%
HIGH SCHOOL DIPLOMA
0.0/ 100
METRIC RATING
289th/ 347
METRIC RANK
87.8%
HIGH SCHOOL DIPLOMA
1.9/ 100
METRIC RATING
243rd/ 347
METRIC RANK
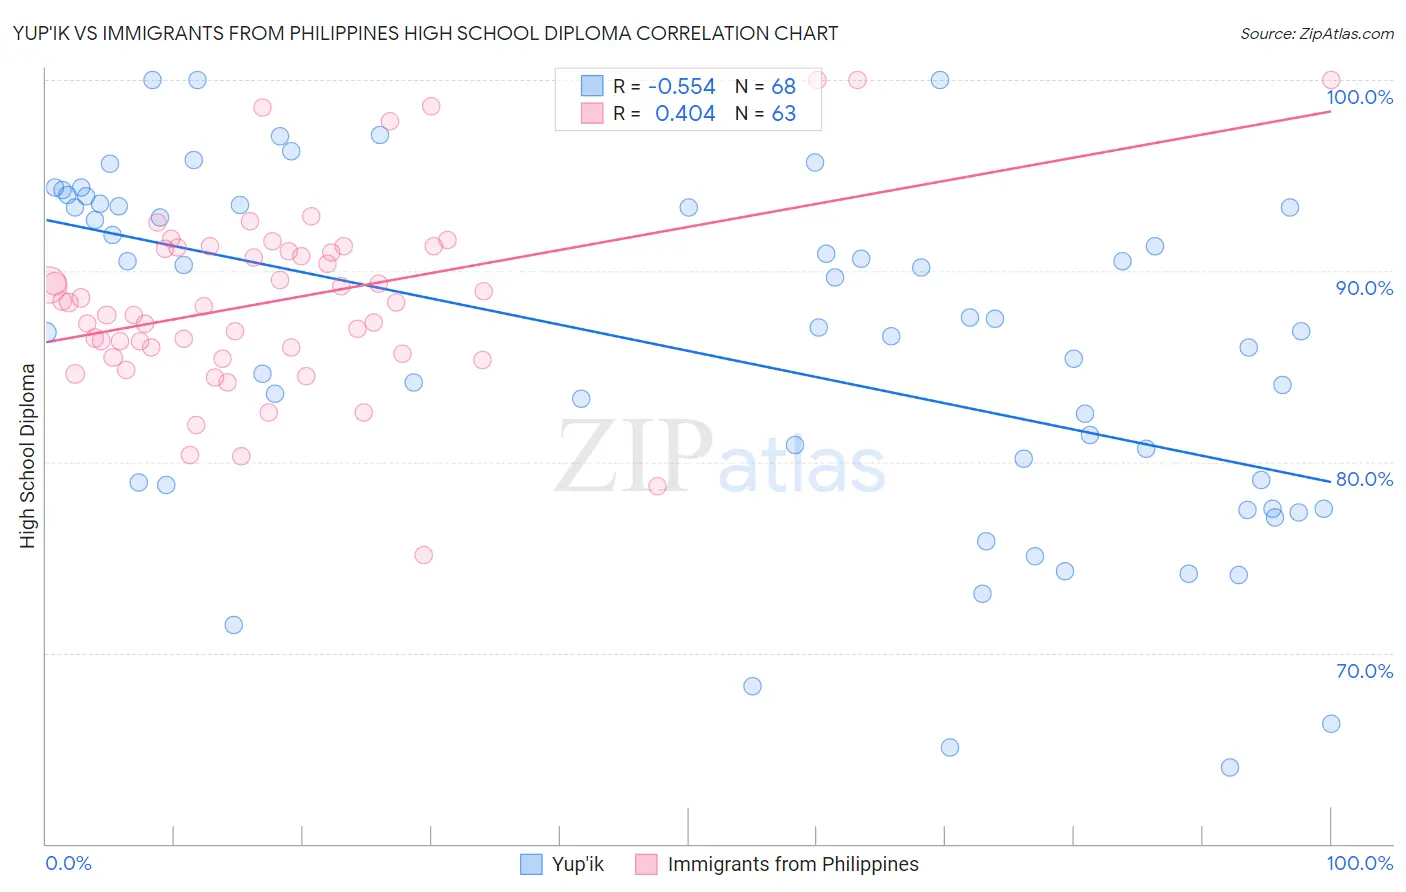
Yup'ik vs Immigrants from Philippines High School Diploma Correlation Chart
The statistical analysis conducted on geographies consisting of 39,964,654 people shows a substantial negative correlation between the proportion of Yup'ik and percentage of population with at least high school diploma education in the United States with a correlation coefficient (R) of -0.554 and weighted average of 86.1%. Similarly, the statistical analysis conducted on geographies consisting of 471,300,535 people shows a moderate positive correlation between the proportion of Immigrants from Philippines and percentage of population with at least high school diploma education in the United States with a correlation coefficient (R) of 0.404 and weighted average of 87.8%, a difference of 2.1%.
High School Diploma Correlation Summary
| Measurement | Yup'ik | Immigrants from Philippines |
| Minimum | 64.0% | 75.1% |
| Maximum | 100.0% | 100.0% |
| Range | 36.0% | 24.9% |
| Mean | 85.8% | 88.5% |
| Median | 86.9% | 88.3% |
| Interquartile 25% (IQ1) | 78.9% | 85.7% |
| Interquartile 75% (IQ3) | 93.4% | 91.2% |
| Interquartile Range (IQR) | 14.5% | 5.6% |
| Standard Deviation (Sample) | 9.1% | 5.0% |
| Standard Deviation (Population) | 9.0% | 4.9% |
Similar Demographics by High School Diploma
Demographics Similar to Yup'ik by High School Diploma
In terms of high school diploma, the demographic groups most similar to Yup'ik are Fijian (86.0%, a difference of 0.070%), Immigrants from Vietnam (86.2%, a difference of 0.11%), Ute (86.2%, a difference of 0.12%), Immigrants from St. Vincent and the Grenadines (86.2%, a difference of 0.15%), and Immigrants from West Indies (86.2%, a difference of 0.17%).
| Demographics | Rating | Rank | High School Diploma |
| Dutch West Indians | 0.0 /100 | #282 | Tragic 86.5% |
| Immigrants | Barbados | 0.0 /100 | #283 | Tragic 86.4% |
| Paiute | 0.0 /100 | #284 | Tragic 86.4% |
| Immigrants | West Indies | 0.0 /100 | #285 | Tragic 86.2% |
| Immigrants | St. Vincent and the Grenadines | 0.0 /100 | #286 | Tragic 86.2% |
| Ute | 0.0 /100 | #287 | Tragic 86.2% |
| Immigrants | Vietnam | 0.0 /100 | #288 | Tragic 86.2% |
| Yup'ik | 0.0 /100 | #289 | Tragic 86.1% |
| Fijians | 0.0 /100 | #290 | Tragic 86.0% |
| Haitians | 0.0 /100 | #291 | Tragic 85.9% |
| Japanese | 0.0 /100 | #292 | Tragic 85.9% |
| British West Indians | 0.0 /100 | #293 | Tragic 85.9% |
| Immigrants | Fiji | 0.0 /100 | #294 | Tragic 85.8% |
| Immigrants | Immigrants | 0.0 /100 | #295 | Tragic 85.8% |
| Immigrants | Cambodia | 0.0 /100 | #296 | Tragic 85.6% |
Demographics Similar to Immigrants from Philippines by High School Diploma
In terms of high school diploma, the demographic groups most similar to Immigrants from Philippines are Choctaw (87.8%, a difference of 0.0%), Peruvian (87.8%, a difference of 0.010%), Immigrants from Uzbekistan (87.8%, a difference of 0.020%), Cheyenne (87.8%, a difference of 0.020%), and Comanche (87.9%, a difference of 0.050%).
| Demographics | Rating | Rank | High School Diploma |
| Sub-Saharan Africans | 2.8 /100 | #236 | Tragic 87.9% |
| Taiwanese | 2.8 /100 | #237 | Tragic 87.9% |
| Sioux | 2.7 /100 | #238 | Tragic 87.9% |
| South Americans | 2.7 /100 | #239 | Tragic 87.9% |
| Comanche | 2.2 /100 | #240 | Tragic 87.9% |
| Immigrants | Uzbekistan | 2.1 /100 | #241 | Tragic 87.8% |
| Cheyenne | 2.1 /100 | #242 | Tragic 87.8% |
| Immigrants | Philippines | 1.9 /100 | #243 | Tragic 87.8% |
| Choctaw | 1.9 /100 | #244 | Tragic 87.8% |
| Peruvians | 1.9 /100 | #245 | Tragic 87.8% |
| Immigrants | Eritrea | 1.7 /100 | #246 | Tragic 87.8% |
| Immigrants | Costa Rica | 1.7 /100 | #247 | Tragic 87.8% |
| Spanish Americans | 1.5 /100 | #248 | Tragic 87.7% |
| Senegalese | 1.5 /100 | #249 | Tragic 87.7% |
| Immigrants | Nigeria | 1.5 /100 | #250 | Tragic 87.7% |