Yup'ik vs Immigrants from Philippines Unemployment Among Ages 60 to 64 years
COMPARE
Yup'ik
Immigrants from Philippines
Unemployment Among Ages 60 to 64 years
Unemployment Among Ages 60 to 64 years Comparison
Yup'ik
Immigrants from Philippines
11.9%
UNEMPLOYMENT AMONG AGES 60 TO 64 YEARS
0.0/ 100
METRIC RATING
347th/ 347
METRIC RANK
5.0%
UNEMPLOYMENT AMONG AGES 60 TO 64 YEARS
1.9/ 100
METRIC RATING
243rd/ 347
METRIC RANK
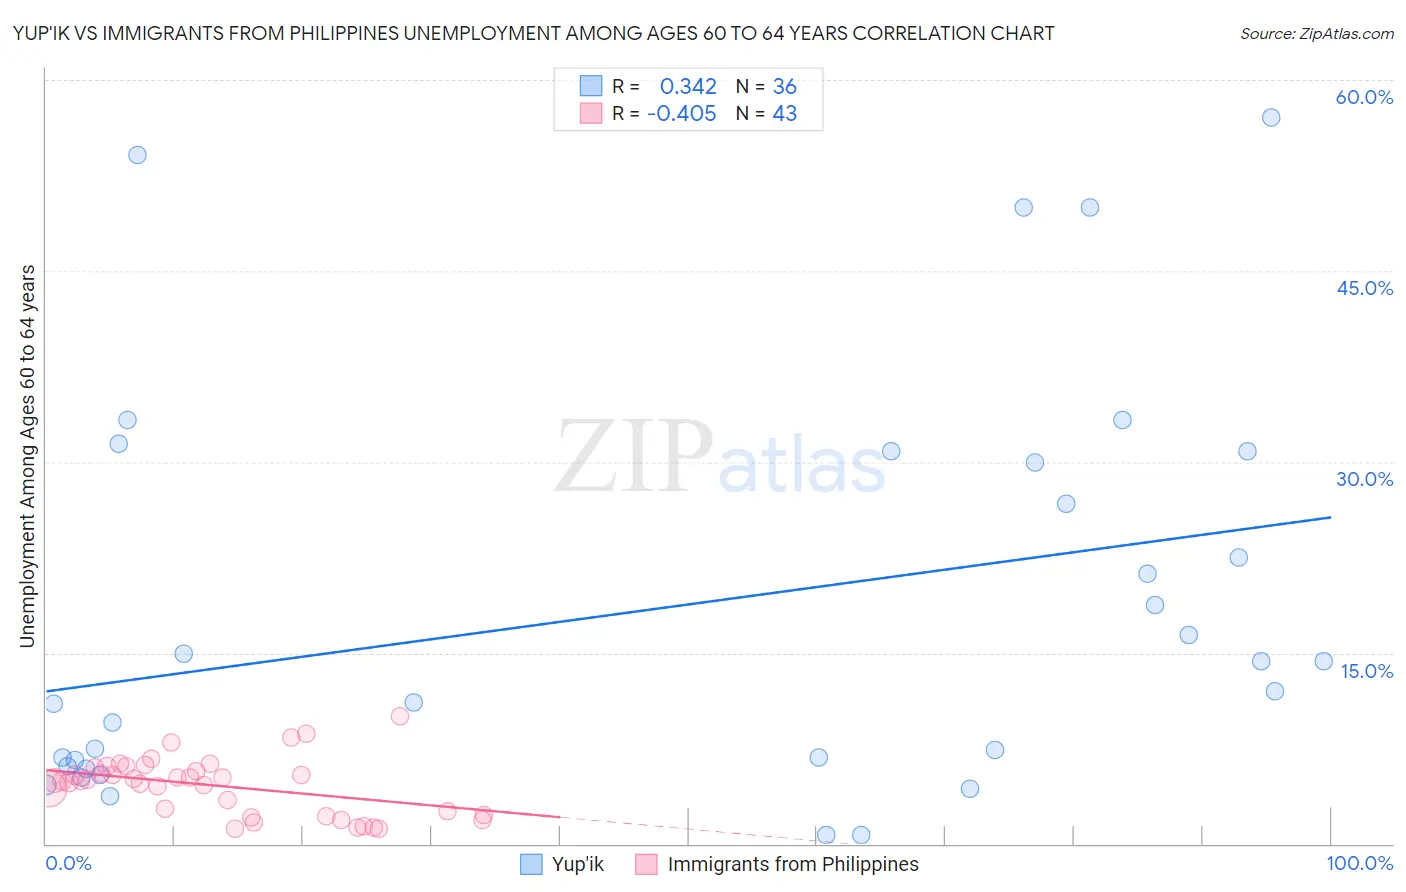
Yup'ik vs Immigrants from Philippines Unemployment Among Ages 60 to 64 years Correlation Chart
The statistical analysis conducted on geographies consisting of 38,589,924 people shows a mild positive correlation between the proportion of Yup'ik and unemployment rate among population between the ages 60 and 64 in the United States with a correlation coefficient (R) of 0.342 and weighted average of 11.9%. Similarly, the statistical analysis conducted on geographies consisting of 416,041,447 people shows a moderate negative correlation between the proportion of Immigrants from Philippines and unemployment rate among population between the ages 60 and 64 in the United States with a correlation coefficient (R) of -0.405 and weighted average of 5.0%, a difference of 137.0%.
Unemployment Among Ages 60 to 64 years Correlation Summary
| Measurement | Yup'ik | Immigrants from Philippines |
| Minimum | 0.70% | 1.2% |
| Maximum | 57.1% | 10.0% |
| Range | 56.4% | 8.8% |
| Mean | 18.5% | 4.6% |
| Median | 13.2% | 5.0% |
| Interquartile 25% (IQ1) | 6.3% | 2.3% |
| Interquartile 75% (IQ3) | 30.4% | 6.0% |
| Interquartile Range (IQR) | 24.1% | 3.7% |
| Standard Deviation (Sample) | 15.8% | 2.2% |
| Standard Deviation (Population) | 15.6% | 2.2% |
Similar Demographics by Unemployment Among Ages 60 to 64 years
Demographics Similar to Yup'ik by Unemployment Among Ages 60 to 64 years
In terms of unemployment among ages 60 to 64 years, the demographic groups most similar to Yup'ik are Inupiat (9.6%, a difference of 24.4%), Alaskan Athabascan (8.4%, a difference of 42.1%), Alaska Native (7.6%, a difference of 56.3%), Immigrants from Yemen (6.8%, a difference of 74.6%), and Aleut (6.8%, a difference of 75.9%).
| Demographics | Rating | Rank | Unemployment Among Ages 60 to 64 years |
| Immigrants | Dominican Republic | 0.0 /100 | #333 | Tragic 6.0% |
| Puerto Ricans | 0.0 /100 | #334 | Tragic 6.1% |
| Vietnamese | 0.0 /100 | #335 | Tragic 6.1% |
| Kiowa | 0.0 /100 | #336 | Tragic 6.2% |
| Navajo | 0.0 /100 | #337 | Tragic 6.3% |
| Arapaho | 0.0 /100 | #338 | Tragic 6.3% |
| Tlingit-Haida | 0.0 /100 | #339 | Tragic 6.4% |
| Pueblo | 0.0 /100 | #340 | Tragic 6.7% |
| Yuman | 0.0 /100 | #341 | Tragic 6.8% |
| Aleuts | 0.0 /100 | #342 | Tragic 6.8% |
| Immigrants | Yemen | 0.0 /100 | #343 | Tragic 6.8% |
| Alaska Natives | 0.0 /100 | #344 | Tragic 7.6% |
| Alaskan Athabascans | 0.0 /100 | #345 | Tragic 8.4% |
| Inupiat | 0.0 /100 | #346 | Tragic 9.6% |
| Yup'ik | 0.0 /100 | #347 | Tragic 11.9% |
Demographics Similar to Immigrants from Philippines by Unemployment Among Ages 60 to 64 years
In terms of unemployment among ages 60 to 64 years, the demographic groups most similar to Immigrants from Philippines are Argentinean (5.0%, a difference of 0.10%), Peruvian (5.0%, a difference of 0.12%), Immigrants from Croatia (5.0%, a difference of 0.15%), Indian (Asian) (5.0%, a difference of 0.15%), and Ghanaian (5.0%, a difference of 0.23%).
| Demographics | Rating | Rank | Unemployment Among Ages 60 to 64 years |
| Immigrants | Sierra Leone | 3.1 /100 | #236 | Tragic 5.0% |
| Immigrants | Western Asia | 3.0 /100 | #237 | Tragic 5.0% |
| Immigrants | Poland | 3.0 /100 | #238 | Tragic 5.0% |
| Ghanaians | 2.4 /100 | #239 | Tragic 5.0% |
| Immigrants | Croatia | 2.2 /100 | #240 | Tragic 5.0% |
| Indians (Asian) | 2.2 /100 | #241 | Tragic 5.0% |
| Argentineans | 2.1 /100 | #242 | Tragic 5.0% |
| Immigrants | Philippines | 1.9 /100 | #243 | Tragic 5.0% |
| Peruvians | 1.6 /100 | #244 | Tragic 5.0% |
| Comanche | 1.3 /100 | #245 | Tragic 5.0% |
| Immigrants | South America | 1.1 /100 | #246 | Tragic 5.0% |
| Immigrants | North Macedonia | 1.1 /100 | #247 | Tragic 5.0% |
| Immigrants | Fiji | 1.1 /100 | #248 | Tragic 5.1% |
| South Americans | 1.0 /100 | #249 | Tragic 5.1% |
| Immigrants | Cambodia | 0.9 /100 | #250 | Tragic 5.1% |