Immigrants from Fiji vs Immigrants from Philippines In Labor Force | Age 30-34
COMPARE
Immigrants from Fiji
Immigrants from Philippines
In Labor Force | Age 30-34
In Labor Force | Age 30-34 Comparison
Immigrants from Fiji
Immigrants from Philippines
83.4%
IN LABOR FORCE | AGE 30-34
0.0/ 100
METRIC RATING
279th/ 347
METRIC RANK
84.6%
IN LABOR FORCE | AGE 30-34
31.5/ 100
METRIC RATING
185th/ 347
METRIC RANK
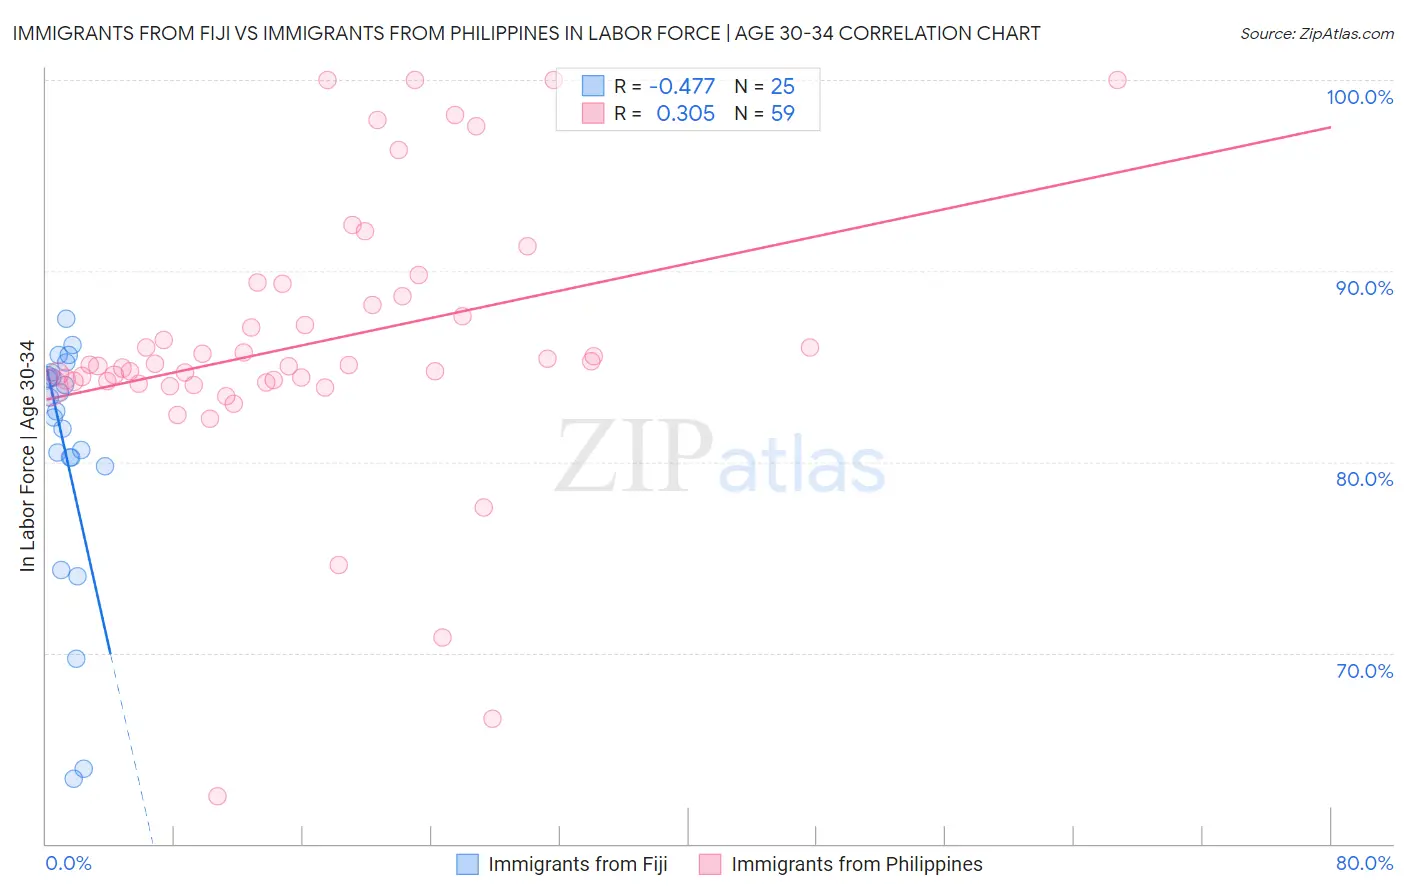
Immigrants from Fiji vs Immigrants from Philippines In Labor Force | Age 30-34 Correlation Chart
The statistical analysis conducted on geographies consisting of 93,755,407 people shows a moderate negative correlation between the proportion of Immigrants from Fiji and labor force participation rate among population between the ages 30 and 34 in the United States with a correlation coefficient (R) of -0.477 and weighted average of 83.4%. Similarly, the statistical analysis conducted on geographies consisting of 471,048,330 people shows a mild positive correlation between the proportion of Immigrants from Philippines and labor force participation rate among population between the ages 30 and 34 in the United States with a correlation coefficient (R) of 0.305 and weighted average of 84.6%, a difference of 1.4%.
In Labor Force | Age 30-34 Correlation Summary
| Measurement | Immigrants from Fiji | Immigrants from Philippines |
| Minimum | 63.4% | 62.5% |
| Maximum | 87.5% | 100.0% |
| Range | 24.1% | 37.5% |
| Mean | 80.5% | 86.2% |
| Median | 82.7% | 85.0% |
| Interquartile 25% (IQ1) | 80.0% | 84.2% |
| Interquartile 75% (IQ3) | 84.6% | 88.7% |
| Interquartile Range (IQR) | 4.6% | 4.5% |
| Standard Deviation (Sample) | 6.5% | 7.1% |
| Standard Deviation (Population) | 6.4% | 7.1% |
Similar Demographics by In Labor Force | Age 30-34
Demographics Similar to Immigrants from Fiji by In Labor Force | Age 30-34
In terms of in labor force | age 30-34, the demographic groups most similar to Immigrants from Fiji are Fijian (83.4%, a difference of 0.010%), African (83.4%, a difference of 0.030%), Delaware (83.5%, a difference of 0.070%), Tongan (83.5%, a difference of 0.080%), and Immigrants from Grenada (83.5%, a difference of 0.090%).
| Demographics | Rating | Rank | In Labor Force | Age 30-34 |
| Immigrants | Nonimmigrants | 0.0 /100 | #272 | Tragic 83.5% |
| Guamanians/Chamorros | 0.0 /100 | #273 | Tragic 83.5% |
| Belizeans | 0.0 /100 | #274 | Tragic 83.5% |
| Immigrants | Grenada | 0.0 /100 | #275 | Tragic 83.5% |
| Tongans | 0.0 /100 | #276 | Tragic 83.5% |
| Delaware | 0.0 /100 | #277 | Tragic 83.5% |
| Fijians | 0.0 /100 | #278 | Tragic 83.4% |
| Immigrants | Fiji | 0.0 /100 | #279 | Tragic 83.4% |
| Africans | 0.0 /100 | #280 | Tragic 83.4% |
| Samoans | 0.0 /100 | #281 | Tragic 83.3% |
| Mexican American Indians | 0.0 /100 | #282 | Tragic 83.2% |
| Assyrians/Chaldeans/Syriacs | 0.0 /100 | #283 | Tragic 83.2% |
| Immigrants | Belize | 0.0 /100 | #284 | Tragic 83.2% |
| Cree | 0.0 /100 | #285 | Tragic 83.2% |
| Immigrants | Latin America | 0.0 /100 | #286 | Tragic 83.1% |
Demographics Similar to Immigrants from Philippines by In Labor Force | Age 30-34
In terms of in labor force | age 30-34, the demographic groups most similar to Immigrants from Philippines are Immigrants from North America (84.6%, a difference of 0.010%), Immigrants from Congo (84.6%, a difference of 0.010%), Costa Rican (84.6%, a difference of 0.020%), Taiwanese (84.6%, a difference of 0.020%), and Nigerian (84.5%, a difference of 0.020%).
| Demographics | Rating | Rank | In Labor Force | Age 30-34 |
| Okinawans | 44.1 /100 | #178 | Average 84.6% |
| Immigrants | Nigeria | 42.5 /100 | #179 | Average 84.6% |
| Immigrants | Netherlands | 42.1 /100 | #180 | Average 84.6% |
| Moroccans | 40.3 /100 | #181 | Average 84.6% |
| Barbadians | 36.7 /100 | #182 | Fair 84.6% |
| Immigrants | Canada | 35.0 /100 | #183 | Fair 84.6% |
| Immigrants | North America | 33.3 /100 | #184 | Fair 84.6% |
| Immigrants | Philippines | 31.5 /100 | #185 | Fair 84.6% |
| Immigrants | Congo | 29.7 /100 | #186 | Fair 84.6% |
| Costa Ricans | 29.6 /100 | #187 | Fair 84.6% |
| Taiwanese | 29.4 /100 | #188 | Fair 84.6% |
| Nigerians | 28.9 /100 | #189 | Fair 84.5% |
| Immigrants | Zaire | 25.8 /100 | #190 | Fair 84.5% |
| Hungarians | 24.8 /100 | #191 | Fair 84.5% |
| Scandinavians | 24.7 /100 | #192 | Fair 84.5% |