Nicaraguan vs Immigrants from Philippines In Labor Force | Age 30-34
COMPARE
Nicaraguan
Immigrants from Philippines
In Labor Force | Age 30-34
In Labor Force | Age 30-34 Comparison
Nicaraguans
Immigrants from Philippines
83.9%
IN LABOR FORCE | AGE 30-34
0.6/ 100
METRIC RATING
251st/ 347
METRIC RANK
84.6%
IN LABOR FORCE | AGE 30-34
31.5/ 100
METRIC RATING
185th/ 347
METRIC RANK
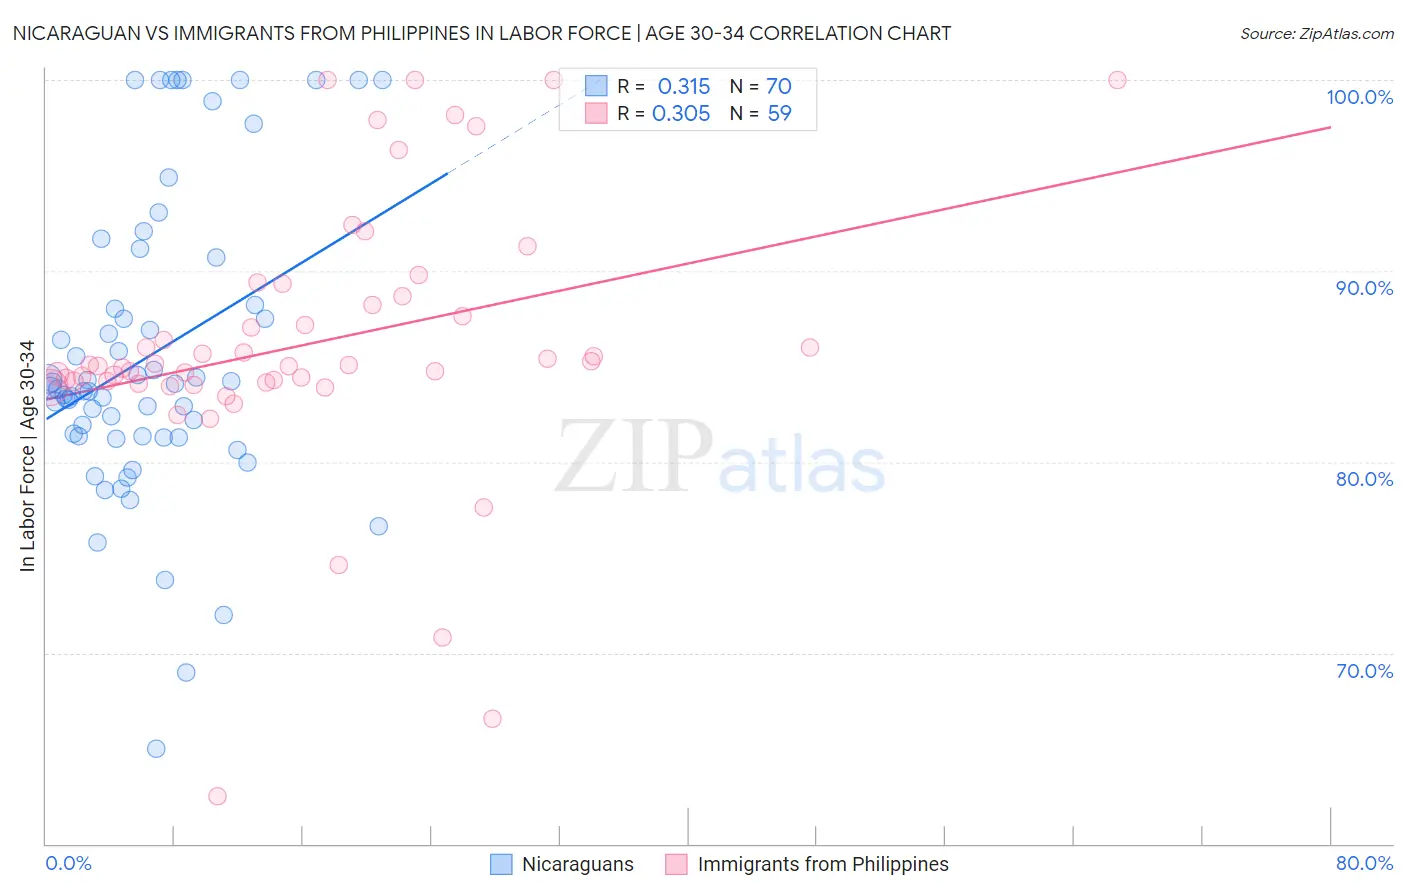
Nicaraguan vs Immigrants from Philippines In Labor Force | Age 30-34 Correlation Chart
The statistical analysis conducted on geographies consisting of 285,621,495 people shows a mild positive correlation between the proportion of Nicaraguans and labor force participation rate among population between the ages 30 and 34 in the United States with a correlation coefficient (R) of 0.315 and weighted average of 83.9%. Similarly, the statistical analysis conducted on geographies consisting of 471,048,330 people shows a mild positive correlation between the proportion of Immigrants from Philippines and labor force participation rate among population between the ages 30 and 34 in the United States with a correlation coefficient (R) of 0.305 and weighted average of 84.6%, a difference of 0.77%.
In Labor Force | Age 30-34 Correlation Summary
| Measurement | Nicaraguan | Immigrants from Philippines |
| Minimum | 65.0% | 62.5% |
| Maximum | 100.0% | 100.0% |
| Range | 35.0% | 37.5% |
| Mean | 85.6% | 86.2% |
| Median | 83.8% | 85.0% |
| Interquartile 25% (IQ1) | 81.3% | 84.2% |
| Interquartile 75% (IQ3) | 88.2% | 88.7% |
| Interquartile Range (IQR) | 6.9% | 4.5% |
| Standard Deviation (Sample) | 7.8% | 7.1% |
| Standard Deviation (Population) | 7.8% | 7.1% |
Similar Demographics by In Labor Force | Age 30-34
Demographics Similar to Nicaraguans by In Labor Force | Age 30-34
In terms of in labor force | age 30-34, the demographic groups most similar to Nicaraguans are Bahamian (83.9%, a difference of 0.0%), Immigrants from Nicaragua (83.9%, a difference of 0.010%), Immigrants from Iraq (83.9%, a difference of 0.020%), Immigrants from St. Vincent and the Grenadines (83.9%, a difference of 0.030%), and Portuguese (84.0%, a difference of 0.040%).
| Demographics | Rating | Rank | In Labor Force | Age 30-34 |
| Basques | 0.9 /100 | #244 | Tragic 84.0% |
| Immigrants | Venezuela | 0.9 /100 | #245 | Tragic 84.0% |
| Central Americans | 0.9 /100 | #246 | Tragic 84.0% |
| British West Indians | 0.8 /100 | #247 | Tragic 84.0% |
| Portuguese | 0.8 /100 | #248 | Tragic 84.0% |
| Immigrants | Dominica | 0.7 /100 | #249 | Tragic 84.0% |
| Immigrants | Iraq | 0.7 /100 | #250 | Tragic 83.9% |
| Nicaraguans | 0.6 /100 | #251 | Tragic 83.9% |
| Bahamians | 0.6 /100 | #252 | Tragic 83.9% |
| Immigrants | Nicaragua | 0.6 /100 | #253 | Tragic 83.9% |
| Immigrants | St. Vincent and the Grenadines | 0.5 /100 | #254 | Tragic 83.9% |
| Whites/Caucasians | 0.5 /100 | #255 | Tragic 83.9% |
| Immigrants | Lebanon | 0.4 /100 | #256 | Tragic 83.9% |
| Iraqis | 0.3 /100 | #257 | Tragic 83.8% |
| Hondurans | 0.3 /100 | #258 | Tragic 83.8% |
Demographics Similar to Immigrants from Philippines by In Labor Force | Age 30-34
In terms of in labor force | age 30-34, the demographic groups most similar to Immigrants from Philippines are Immigrants from North America (84.6%, a difference of 0.010%), Immigrants from Congo (84.6%, a difference of 0.010%), Costa Rican (84.6%, a difference of 0.020%), Taiwanese (84.6%, a difference of 0.020%), and Nigerian (84.5%, a difference of 0.020%).
| Demographics | Rating | Rank | In Labor Force | Age 30-34 |
| Okinawans | 44.1 /100 | #178 | Average 84.6% |
| Immigrants | Nigeria | 42.5 /100 | #179 | Average 84.6% |
| Immigrants | Netherlands | 42.1 /100 | #180 | Average 84.6% |
| Moroccans | 40.3 /100 | #181 | Average 84.6% |
| Barbadians | 36.7 /100 | #182 | Fair 84.6% |
| Immigrants | Canada | 35.0 /100 | #183 | Fair 84.6% |
| Immigrants | North America | 33.3 /100 | #184 | Fair 84.6% |
| Immigrants | Philippines | 31.5 /100 | #185 | Fair 84.6% |
| Immigrants | Congo | 29.7 /100 | #186 | Fair 84.6% |
| Costa Ricans | 29.6 /100 | #187 | Fair 84.6% |
| Taiwanese | 29.4 /100 | #188 | Fair 84.6% |
| Nigerians | 28.9 /100 | #189 | Fair 84.5% |
| Immigrants | Zaire | 25.8 /100 | #190 | Fair 84.5% |
| Hungarians | 24.8 /100 | #191 | Fair 84.5% |
| Scandinavians | 24.7 /100 | #192 | Fair 84.5% |