Yup'ik vs Korean In Labor Force | Age 30-34
COMPARE
Yup'ik
Korean
In Labor Force | Age 30-34
In Labor Force | Age 30-34 Comparison
Yup'ik
Koreans
76.4%
IN LABOR FORCE | AGE 30-34
0.0/ 100
METRIC RATING
345th/ 347
METRIC RANK
84.5%
IN LABOR FORCE | AGE 30-34
23.2/ 100
METRIC RATING
195th/ 347
METRIC RANK
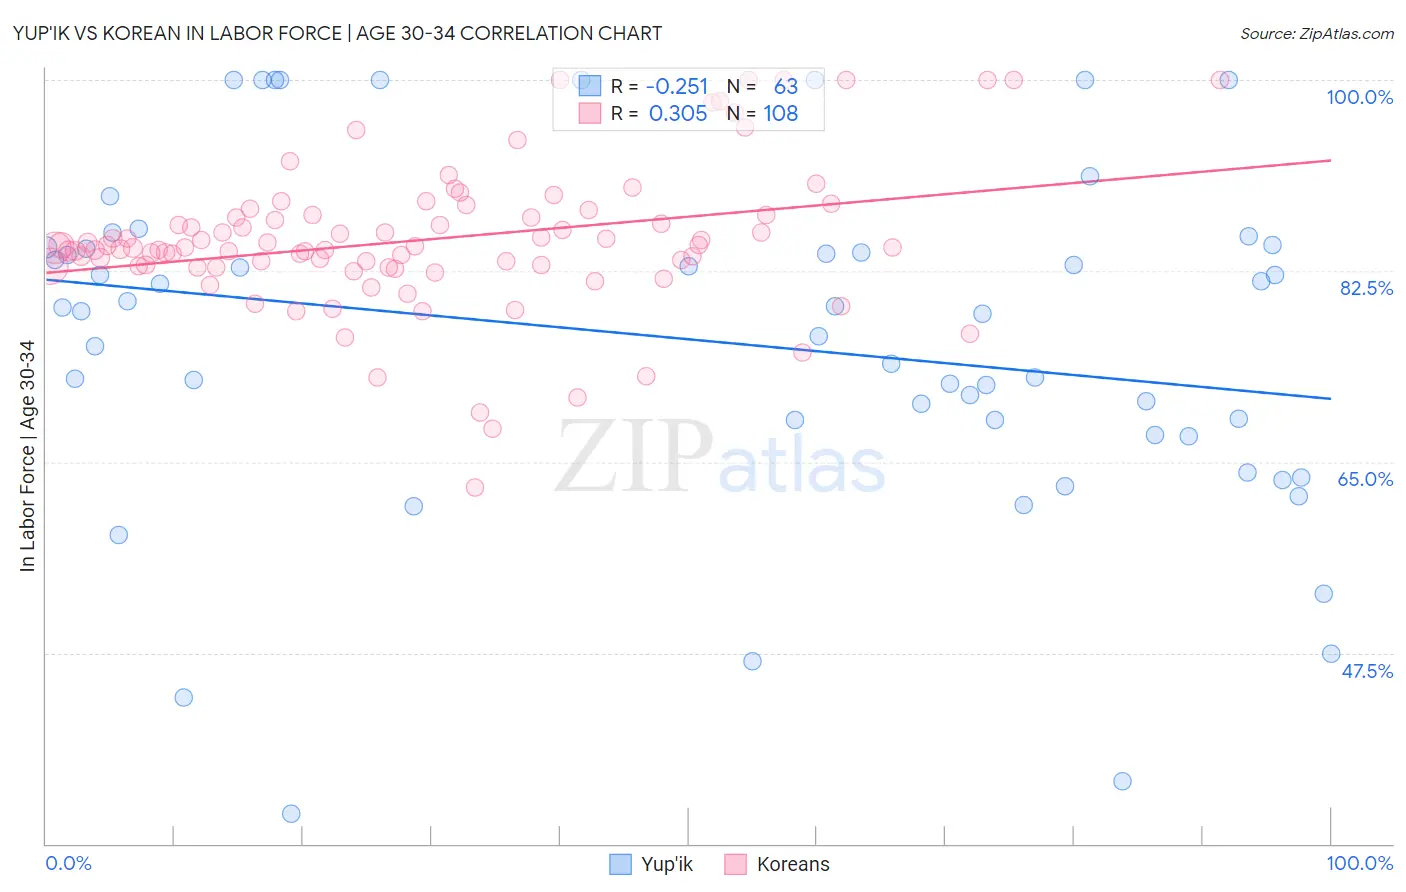
Yup'ik vs Korean In Labor Force | Age 30-34 Correlation Chart
The statistical analysis conducted on geographies consisting of 39,955,803 people shows a weak negative correlation between the proportion of Yup'ik and labor force participation rate among population between the ages 30 and 34 in the United States with a correlation coefficient (R) of -0.251 and weighted average of 76.4%. Similarly, the statistical analysis conducted on geographies consisting of 510,404,908 people shows a mild positive correlation between the proportion of Koreans and labor force participation rate among population between the ages 30 and 34 in the United States with a correlation coefficient (R) of 0.305 and weighted average of 84.5%, a difference of 10.6%.
In Labor Force | Age 30-34 Correlation Summary
| Measurement | Yup'ik | Korean |
| Minimum | 32.8% | 62.6% |
| Maximum | 100.0% | 100.0% |
| Range | 67.2% | 37.4% |
| Mean | 76.1% | 85.4% |
| Median | 78.8% | 84.7% |
| Interquartile 25% (IQ1) | 67.5% | 83.0% |
| Interquartile 75% (IQ3) | 84.7% | 87.6% |
| Interquartile Range (IQR) | 17.2% | 4.7% |
| Standard Deviation (Sample) | 15.8% | 6.7% |
| Standard Deviation (Population) | 15.7% | 6.7% |
Similar Demographics by In Labor Force | Age 30-34
Demographics Similar to Yup'ik by In Labor Force | Age 30-34
In terms of in labor force | age 30-34, the demographic groups most similar to Yup'ik are Crow (75.9%, a difference of 0.68%), Yuman (77.1%, a difference of 0.87%), Lumbee (77.3%, a difference of 1.1%), Tohono O'odham (77.7%, a difference of 1.7%), and Immigrants from Yemen (78.2%, a difference of 2.3%).
| Demographics | Rating | Rank | In Labor Force | Age 30-34 |
| Inupiat | 0.0 /100 | #333 | Tragic 79.7% |
| Hopi | 0.0 /100 | #334 | Tragic 79.3% |
| Marshallese | 0.0 /100 | #335 | Tragic 79.2% |
| Natives/Alaskans | 0.0 /100 | #336 | Tragic 79.2% |
| Yakama | 0.0 /100 | #337 | Tragic 79.1% |
| Pima | 0.0 /100 | #338 | Tragic 79.0% |
| Apache | 0.0 /100 | #339 | Tragic 79.0% |
| Ute | 0.0 /100 | #340 | Tragic 78.9% |
| Immigrants | Yemen | 0.0 /100 | #341 | Tragic 78.2% |
| Tohono O'odham | 0.0 /100 | #342 | Tragic 77.7% |
| Lumbee | 0.0 /100 | #343 | Tragic 77.3% |
| Yuman | 0.0 /100 | #344 | Tragic 77.1% |
| Yup'ik | 0.0 /100 | #345 | Tragic 76.4% |
| Crow | 0.0 /100 | #346 | Tragic 75.9% |
| Navajo | 0.0 /100 | #347 | Tragic 73.8% |
Demographics Similar to Koreans by In Labor Force | Age 30-34
In terms of in labor force | age 30-34, the demographic groups most similar to Koreans are Immigrants from Afghanistan (84.5%, a difference of 0.0%), British (84.5%, a difference of 0.0%), Scandinavian (84.5%, a difference of 0.010%), Immigrants from Costa Rica (84.5%, a difference of 0.010%), and Immigrants from Syria (84.5%, a difference of 0.010%).
| Demographics | Rating | Rank | In Labor Force | Age 30-34 |
| Taiwanese | 29.4 /100 | #188 | Fair 84.6% |
| Nigerians | 28.9 /100 | #189 | Fair 84.5% |
| Immigrants | Zaire | 25.8 /100 | #190 | Fair 84.5% |
| Hungarians | 24.8 /100 | #191 | Fair 84.5% |
| Scandinavians | 24.7 /100 | #192 | Fair 84.5% |
| Immigrants | Costa Rica | 23.9 /100 | #193 | Fair 84.5% |
| Immigrants | Afghanistan | 23.5 /100 | #194 | Fair 84.5% |
| Koreans | 23.2 /100 | #195 | Fair 84.5% |
| British | 22.9 /100 | #196 | Fair 84.5% |
| Immigrants | Syria | 21.9 /100 | #197 | Fair 84.5% |
| Dutch | 20.2 /100 | #198 | Fair 84.5% |
| Immigrants | Thailand | 19.1 /100 | #199 | Poor 84.5% |
| Sub-Saharan Africans | 19.0 /100 | #200 | Poor 84.5% |
| Trinidadians and Tobagonians | 18.2 /100 | #201 | Poor 84.5% |
| Immigrants | West Indies | 18.1 /100 | #202 | Poor 84.5% |