Yup'ik vs Panamanian In Labor Force | Age 30-34
COMPARE
Yup'ik
Panamanian
In Labor Force | Age 30-34
In Labor Force | Age 30-34 Comparison
Yup'ik
Panamanians
76.4%
IN LABOR FORCE | AGE 30-34
0.0/ 100
METRIC RATING
345th/ 347
METRIC RANK
84.2%
IN LABOR FORCE | AGE 30-34
3.8/ 100
METRIC RATING
222nd/ 347
METRIC RANK
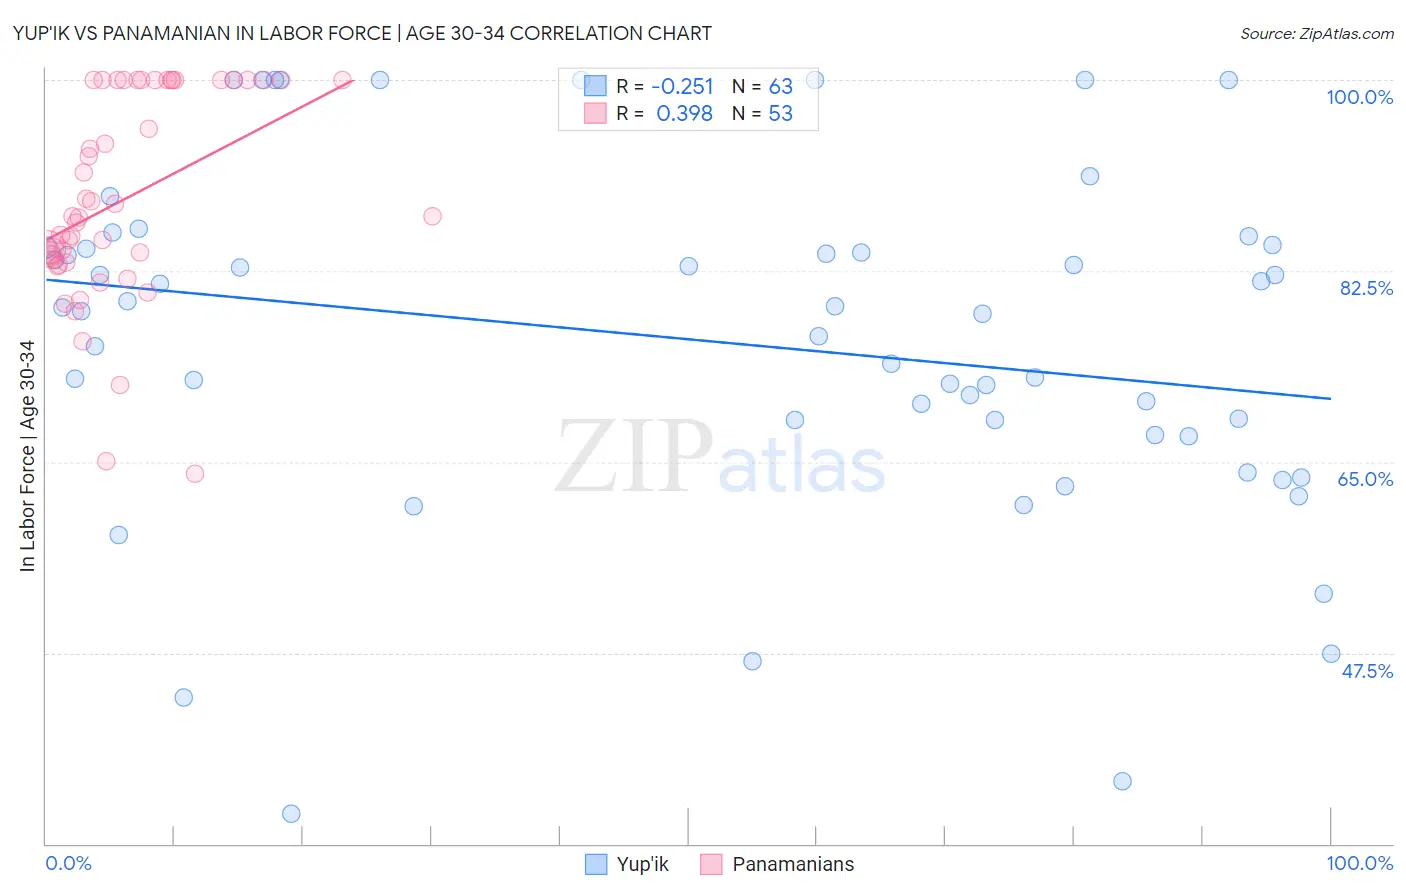
Yup'ik vs Panamanian In Labor Force | Age 30-34 Correlation Chart
The statistical analysis conducted on geographies consisting of 39,955,803 people shows a weak negative correlation between the proportion of Yup'ik and labor force participation rate among population between the ages 30 and 34 in the United States with a correlation coefficient (R) of -0.251 and weighted average of 76.4%. Similarly, the statistical analysis conducted on geographies consisting of 281,117,807 people shows a mild positive correlation between the proportion of Panamanians and labor force participation rate among population between the ages 30 and 34 in the United States with a correlation coefficient (R) of 0.398 and weighted average of 84.2%, a difference of 10.2%.
In Labor Force | Age 30-34 Correlation Summary
| Measurement | Yup'ik | Panamanian |
| Minimum | 32.8% | 63.9% |
| Maximum | 100.0% | 100.0% |
| Range | 67.2% | 36.1% |
| Mean | 76.1% | 89.1% |
| Median | 78.8% | 87.5% |
| Interquartile 25% (IQ1) | 67.5% | 83.4% |
| Interquartile 75% (IQ3) | 84.7% | 100.0% |
| Interquartile Range (IQR) | 17.2% | 16.6% |
| Standard Deviation (Sample) | 15.8% | 9.4% |
| Standard Deviation (Population) | 15.7% | 9.3% |
Similar Demographics by In Labor Force | Age 30-34
Demographics Similar to Yup'ik by In Labor Force | Age 30-34
In terms of in labor force | age 30-34, the demographic groups most similar to Yup'ik are Crow (75.9%, a difference of 0.68%), Yuman (77.1%, a difference of 0.87%), Lumbee (77.3%, a difference of 1.1%), Tohono O'odham (77.7%, a difference of 1.7%), and Immigrants from Yemen (78.2%, a difference of 2.3%).
| Demographics | Rating | Rank | In Labor Force | Age 30-34 |
| Inupiat | 0.0 /100 | #333 | Tragic 79.7% |
| Hopi | 0.0 /100 | #334 | Tragic 79.3% |
| Marshallese | 0.0 /100 | #335 | Tragic 79.2% |
| Natives/Alaskans | 0.0 /100 | #336 | Tragic 79.2% |
| Yakama | 0.0 /100 | #337 | Tragic 79.1% |
| Pima | 0.0 /100 | #338 | Tragic 79.0% |
| Apache | 0.0 /100 | #339 | Tragic 79.0% |
| Ute | 0.0 /100 | #340 | Tragic 78.9% |
| Immigrants | Yemen | 0.0 /100 | #341 | Tragic 78.2% |
| Tohono O'odham | 0.0 /100 | #342 | Tragic 77.7% |
| Lumbee | 0.0 /100 | #343 | Tragic 77.3% |
| Yuman | 0.0 /100 | #344 | Tragic 77.1% |
| Yup'ik | 0.0 /100 | #345 | Tragic 76.4% |
| Crow | 0.0 /100 | #346 | Tragic 75.9% |
| Navajo | 0.0 /100 | #347 | Tragic 73.8% |
Demographics Similar to Panamanians by In Labor Force | Age 30-34
In terms of in labor force | age 30-34, the demographic groups most similar to Panamanians are Salvadoran (84.2%, a difference of 0.0%), Immigrants from Laos (84.2%, a difference of 0.010%), Cuban (84.2%, a difference of 0.020%), Scottish (84.2%, a difference of 0.040%), and Immigrants from El Salvador (84.2%, a difference of 0.040%).
| Demographics | Rating | Rank | In Labor Force | Age 30-34 |
| Europeans | 7.2 /100 | #215 | Tragic 84.3% |
| Immigrants | Ecuador | 7.1 /100 | #216 | Tragic 84.3% |
| Immigrants | Trinidad and Tobago | 7.0 /100 | #217 | Tragic 84.3% |
| Immigrants | Panama | 6.3 /100 | #218 | Tragic 84.3% |
| Swiss | 5.8 /100 | #219 | Tragic 84.3% |
| Danes | 5.3 /100 | #220 | Tragic 84.3% |
| Salvadorans | 3.8 /100 | #221 | Tragic 84.2% |
| Panamanians | 3.8 /100 | #222 | Tragic 84.2% |
| Immigrants | Laos | 3.6 /100 | #223 | Tragic 84.2% |
| Cubans | 3.4 /100 | #224 | Tragic 84.2% |
| Scottish | 3.1 /100 | #225 | Tragic 84.2% |
| Immigrants | El Salvador | 3.0 /100 | #226 | Tragic 84.2% |
| Immigrants | Cuba | 3.0 /100 | #227 | Tragic 84.2% |
| Immigrants | Haiti | 2.8 /100 | #228 | Tragic 84.2% |
| Welsh | 2.7 /100 | #229 | Tragic 84.2% |