Swiss vs Central American In Labor Force | Age 35-44
COMPARE
Swiss
Central American
In Labor Force | Age 35-44
In Labor Force | Age 35-44 Comparison
Swiss
Central Americans
84.2%
IN LABOR FORCE | AGE 35-44
17.4/ 100
METRIC RATING
209th/ 347
METRIC RANK
83.5%
IN LABOR FORCE | AGE 35-44
0.1/ 100
METRIC RATING
265th/ 347
METRIC RANK
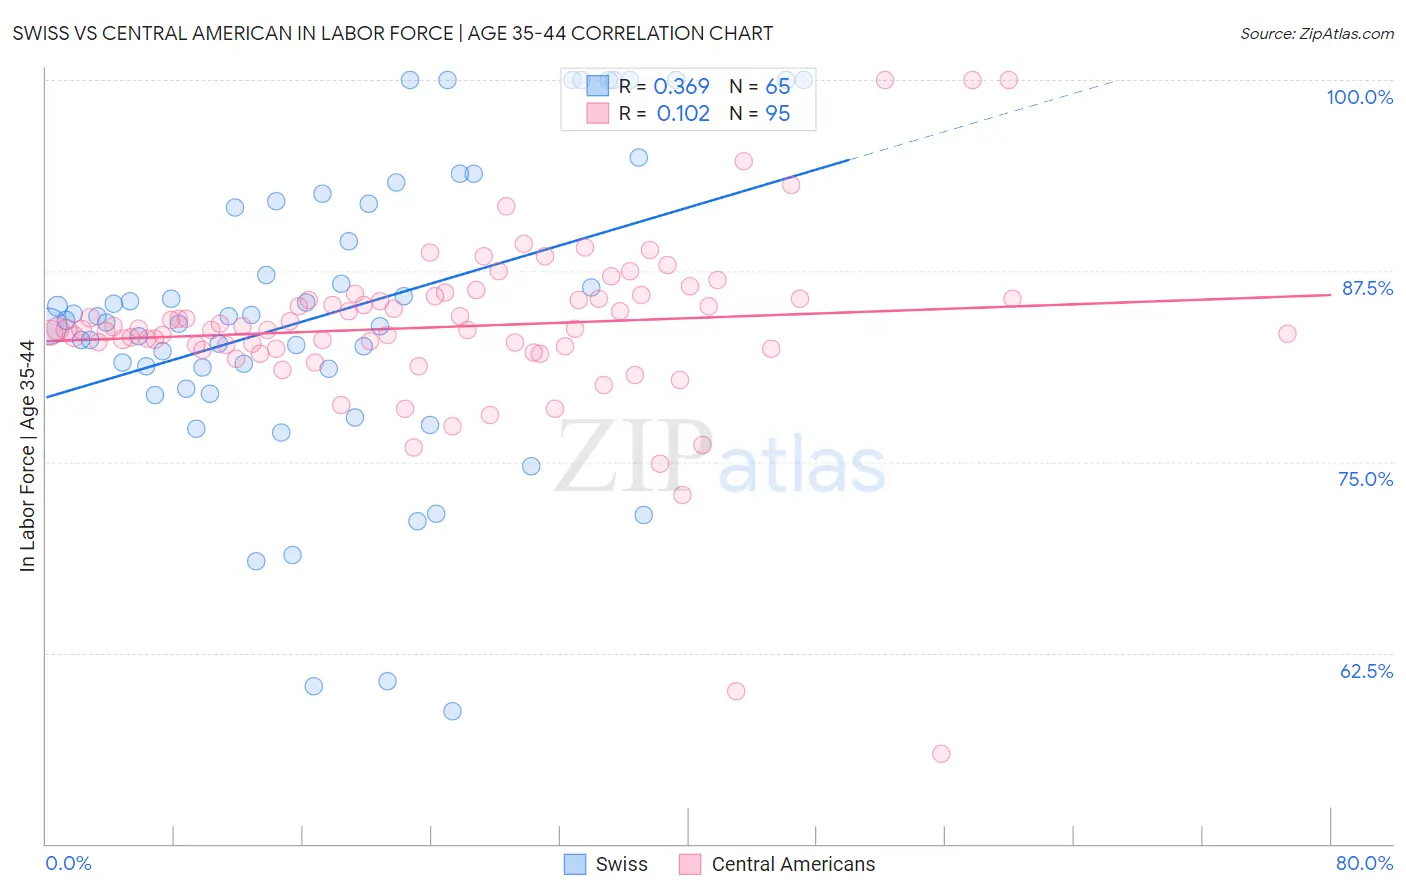
Swiss vs Central American In Labor Force | Age 35-44 Correlation Chart
The statistical analysis conducted on geographies consisting of 464,764,529 people shows a mild positive correlation between the proportion of Swiss and labor force participation rate among population between the ages 35 and 44 in the United States with a correlation coefficient (R) of 0.369 and weighted average of 84.2%. Similarly, the statistical analysis conducted on geographies consisting of 504,181,115 people shows a poor positive correlation between the proportion of Central Americans and labor force participation rate among population between the ages 35 and 44 in the United States with a correlation coefficient (R) of 0.102 and weighted average of 83.5%, a difference of 0.84%.
In Labor Force | Age 35-44 Correlation Summary
| Measurement | Swiss | Central American |
| Minimum | 58.7% | 55.9% |
| Maximum | 100.0% | 100.0% |
| Range | 41.3% | 44.1% |
| Mean | 84.7% | 83.8% |
| Median | 84.3% | 83.7% |
| Interquartile 25% (IQ1) | 80.4% | 82.4% |
| Interquartile 75% (IQ3) | 92.0% | 85.7% |
| Interquartile Range (IQR) | 11.6% | 3.3% |
| Standard Deviation (Sample) | 9.9% | 5.9% |
| Standard Deviation (Population) | 9.9% | 5.8% |
Similar Demographics by In Labor Force | Age 35-44
Demographics Similar to Swiss by In Labor Force | Age 35-44
In terms of in labor force | age 35-44, the demographic groups most similar to Swiss are Immigrants from North America (84.2%, a difference of 0.010%), New Zealander (84.1%, a difference of 0.010%), Immigrants from Canada (84.2%, a difference of 0.020%), Immigrants from Costa Rica (84.2%, a difference of 0.020%), and Laotian (84.2%, a difference of 0.020%).
| Demographics | Rating | Rank | In Labor Force | Age 35-44 |
| Immigrants | Uzbekistan | 22.8 /100 | #202 | Fair 84.2% |
| Immigrants | South Eastern Asia | 22.4 /100 | #203 | Fair 84.2% |
| Canadians | 19.9 /100 | #204 | Poor 84.2% |
| Immigrants | Canada | 19.6 /100 | #205 | Poor 84.2% |
| Immigrants | Costa Rica | 19.5 /100 | #206 | Poor 84.2% |
| Laotians | 19.0 /100 | #207 | Poor 84.2% |
| Immigrants | North America | 18.1 /100 | #208 | Poor 84.2% |
| Swiss | 17.4 /100 | #209 | Poor 84.2% |
| New Zealanders | 16.2 /100 | #210 | Poor 84.1% |
| Immigrants | Ecuador | 15.2 /100 | #211 | Poor 84.1% |
| Israelis | 14.0 /100 | #212 | Poor 84.1% |
| Bangladeshis | 13.7 /100 | #213 | Poor 84.1% |
| Immigrants | Barbados | 13.2 /100 | #214 | Poor 84.1% |
| Europeans | 12.2 /100 | #215 | Poor 84.1% |
| Nicaraguans | 12.1 /100 | #216 | Poor 84.1% |
Demographics Similar to Central Americans by In Labor Force | Age 35-44
In terms of in labor force | age 35-44, the demographic groups most similar to Central Americans are Scotch-Irish (83.5%, a difference of 0.010%), Iroquois (83.5%, a difference of 0.040%), Spaniard (83.4%, a difference of 0.040%), Immigrants from Congo (83.5%, a difference of 0.060%), and Vietnamese (83.5%, a difference of 0.070%).
| Demographics | Rating | Rank | In Labor Force | Age 35-44 |
| Tsimshian | 0.2 /100 | #258 | Tragic 83.5% |
| Immigrants | El Salvador | 0.2 /100 | #259 | Tragic 83.5% |
| Vietnamese | 0.2 /100 | #260 | Tragic 83.5% |
| Immigrants | Dominica | 0.2 /100 | #261 | Tragic 83.5% |
| Immigrants | Congo | 0.2 /100 | #262 | Tragic 83.5% |
| Iroquois | 0.2 /100 | #263 | Tragic 83.5% |
| Scotch-Irish | 0.1 /100 | #264 | Tragic 83.5% |
| Central Americans | 0.1 /100 | #265 | Tragic 83.5% |
| Spaniards | 0.1 /100 | #266 | Tragic 83.4% |
| Guamanians/Chamorros | 0.1 /100 | #267 | Tragic 83.4% |
| Hondurans | 0.1 /100 | #268 | Tragic 83.4% |
| Immigrants | Grenada | 0.1 /100 | #269 | Tragic 83.3% |
| Immigrants | Honduras | 0.0 /100 | #270 | Tragic 83.3% |
| French American Indians | 0.0 /100 | #271 | Tragic 83.2% |
| Immigrants | Fiji | 0.0 /100 | #272 | Tragic 83.2% |