Swiss vs Central American College, Under 1 year
COMPARE
Swiss
Central American
College, Under 1 year
College, Under 1 year Comparison
Swiss
Central Americans
65.5%
COLLEGE, UNDER 1 YEAR
53.9/ 100
METRIC RATING
173rd/ 347
METRIC RANK
57.7%
COLLEGE, UNDER 1 YEAR
0.0/ 100
METRIC RATING
308th/ 347
METRIC RANK
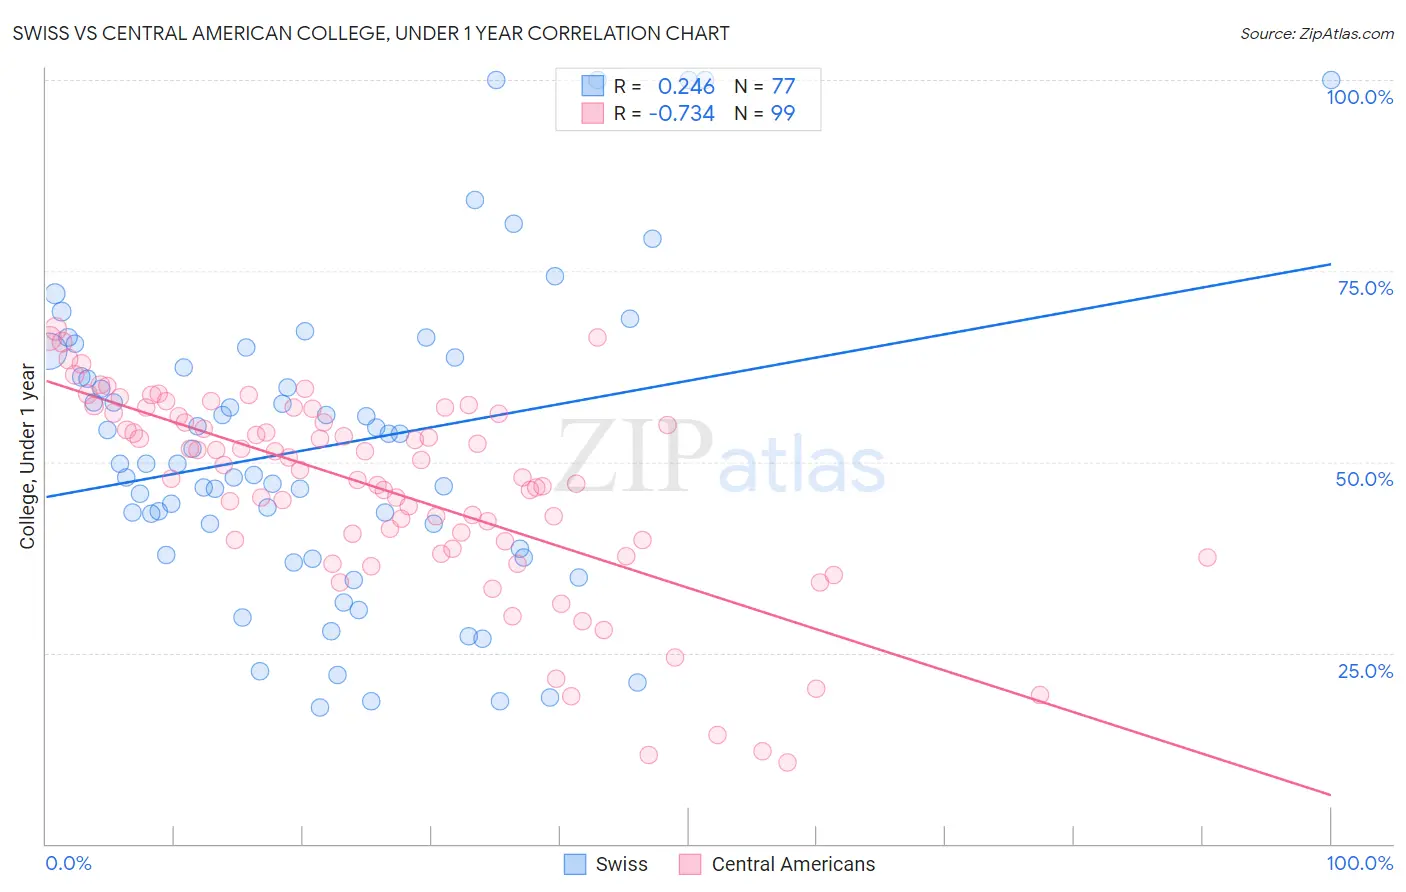
Swiss vs Central American College, Under 1 year Correlation Chart
The statistical analysis conducted on geographies consisting of 465,017,987 people shows a weak positive correlation between the proportion of Swiss and percentage of population with at least college, under 1 year education in the United States with a correlation coefficient (R) of 0.246 and weighted average of 65.5%. Similarly, the statistical analysis conducted on geographies consisting of 504,615,987 people shows a strong negative correlation between the proportion of Central Americans and percentage of population with at least college, under 1 year education in the United States with a correlation coefficient (R) of -0.734 and weighted average of 57.7%, a difference of 13.6%.
College, Under 1 year Correlation Summary
| Measurement | Swiss | Central American |
| Minimum | 17.9% | 10.7% |
| Maximum | 100.0% | 67.5% |
| Range | 82.1% | 56.8% |
| Mean | 52.0% | 46.4% |
| Median | 49.7% | 48.9% |
| Interquartile 25% (IQ1) | 38.2% | 39.6% |
| Interquartile 75% (IQ3) | 63.0% | 56.3% |
| Interquartile Range (IQR) | 24.8% | 16.7% |
| Standard Deviation (Sample) | 20.0% | 13.0% |
| Standard Deviation (Population) | 19.9% | 12.9% |
Similar Demographics by College, Under 1 year
Demographics Similar to Swiss by College, Under 1 year
In terms of college, under 1 year, the demographic groups most similar to Swiss are South American Indian (65.5%, a difference of 0.020%), Immigrants from Oceania (65.6%, a difference of 0.050%), Yugoslavian (65.6%, a difference of 0.080%), German (65.6%, a difference of 0.080%), and Hungarian (65.6%, a difference of 0.090%).
| Demographics | Rating | Rank | College, Under 1 year |
| Moroccans | 56.7 /100 | #166 | Average 65.6% |
| Immigrants | Somalia | 56.4 /100 | #167 | Average 65.6% |
| Hungarians | 55.9 /100 | #168 | Average 65.6% |
| Yugoslavians | 55.7 /100 | #169 | Average 65.6% |
| Germans | 55.7 /100 | #170 | Average 65.6% |
| Immigrants | Oceania | 55.0 /100 | #171 | Average 65.6% |
| South American Indians | 54.4 /100 | #172 | Average 65.5% |
| Swiss | 53.9 /100 | #173 | Average 65.5% |
| Immigrants | Bosnia and Herzegovina | 50.0 /100 | #174 | Average 65.4% |
| Scotch-Irish | 49.5 /100 | #175 | Average 65.4% |
| French | 48.9 /100 | #176 | Average 65.4% |
| Immigrants | North Macedonia | 48.6 /100 | #177 | Average 65.4% |
| German Russians | 48.3 /100 | #178 | Average 65.4% |
| Guamanians/Chamorros | 48.2 /100 | #179 | Average 65.4% |
| Dutch | 46.1 /100 | #180 | Average 65.3% |
Demographics Similar to Central Americans by College, Under 1 year
In terms of college, under 1 year, the demographic groups most similar to Central Americans are Fijian (57.7%, a difference of 0.0%), Immigrants from Portugal (57.7%, a difference of 0.010%), Immigrants from Nicaragua (57.6%, a difference of 0.12%), Haitian (57.8%, a difference of 0.21%), and Kiowa (57.8%, a difference of 0.32%).
| Demographics | Rating | Rank | College, Under 1 year |
| Mexican American Indians | 0.0 /100 | #301 | Tragic 58.1% |
| Apache | 0.0 /100 | #302 | Tragic 58.0% |
| Immigrants | Dominica | 0.0 /100 | #303 | Tragic 57.9% |
| Kiowa | 0.0 /100 | #304 | Tragic 57.8% |
| Haitians | 0.0 /100 | #305 | Tragic 57.8% |
| Immigrants | Portugal | 0.0 /100 | #306 | Tragic 57.7% |
| Fijians | 0.0 /100 | #307 | Tragic 57.7% |
| Central Americans | 0.0 /100 | #308 | Tragic 57.7% |
| Immigrants | Nicaragua | 0.0 /100 | #309 | Tragic 57.6% |
| Pueblo | 0.0 /100 | #310 | Tragic 57.4% |
| Cajuns | 0.0 /100 | #311 | Tragic 57.3% |
| Salvadorans | 0.0 /100 | #312 | Tragic 57.3% |
| Dutch West Indians | 0.0 /100 | #313 | Tragic 57.2% |
| Hopi | 0.0 /100 | #314 | Tragic 57.1% |
| Hondurans | 0.0 /100 | #315 | Tragic 57.1% |