Tohono O'odham vs Central American In Labor Force | Age 35-44
COMPARE
Tohono O'odham
Central American
In Labor Force | Age 35-44
In Labor Force | Age 35-44 Comparison
Tohono O'odham
Central Americans
74.1%
IN LABOR FORCE | AGE 35-44
0.0/ 100
METRIC RATING
346th/ 347
METRIC RANK
83.5%
IN LABOR FORCE | AGE 35-44
0.1/ 100
METRIC RATING
265th/ 347
METRIC RANK
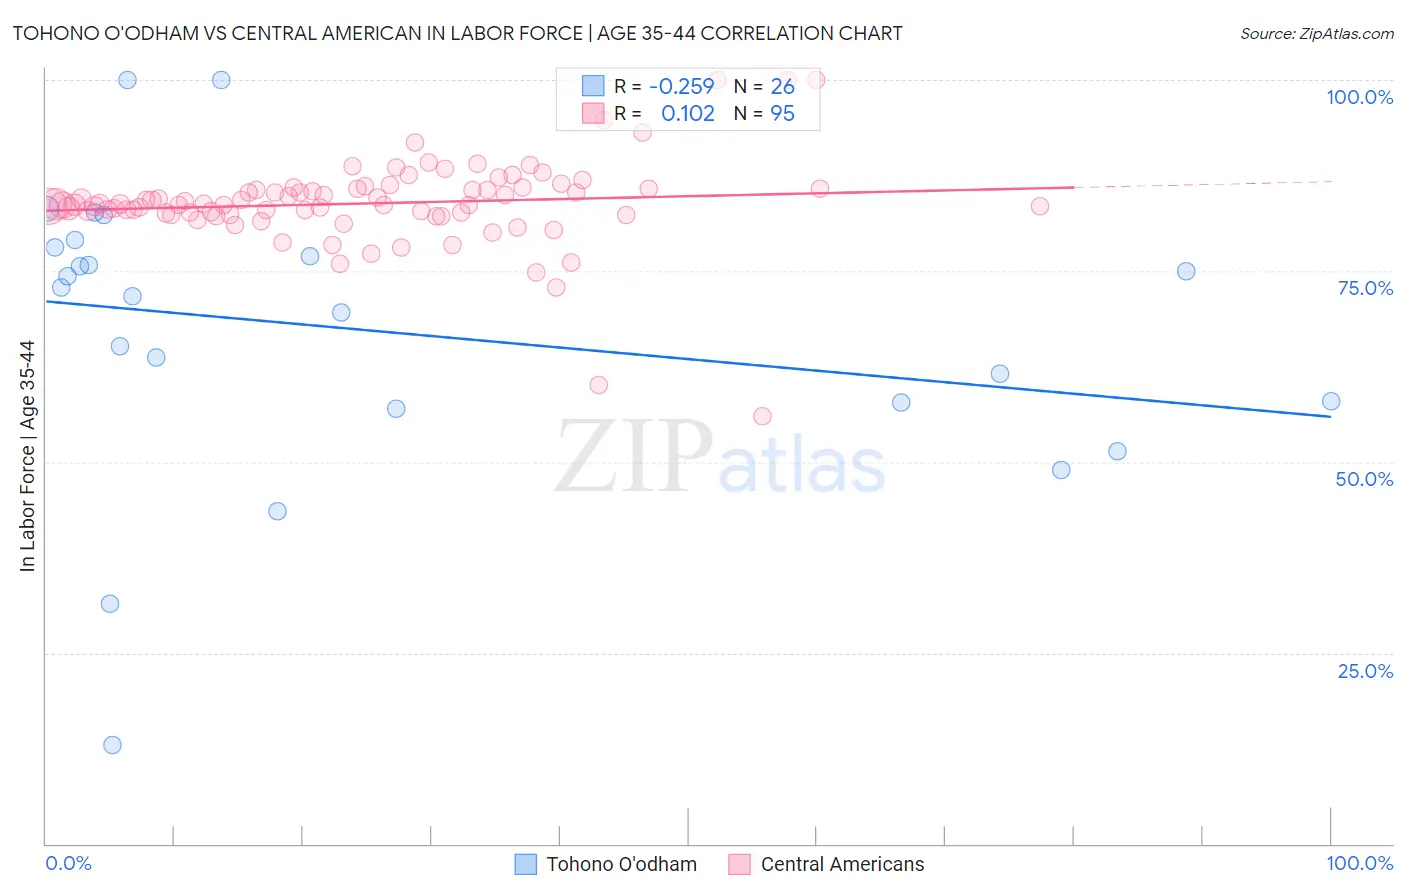
Tohono O'odham vs Central American In Labor Force | Age 35-44 Correlation Chart
The statistical analysis conducted on geographies consisting of 58,719,465 people shows a weak negative correlation between the proportion of Tohono O'odham and labor force participation rate among population between the ages 35 and 44 in the United States with a correlation coefficient (R) of -0.259 and weighted average of 74.1%. Similarly, the statistical analysis conducted on geographies consisting of 504,181,115 people shows a poor positive correlation between the proportion of Central Americans and labor force participation rate among population between the ages 35 and 44 in the United States with a correlation coefficient (R) of 0.102 and weighted average of 83.5%, a difference of 12.6%.
In Labor Force | Age 35-44 Correlation Summary
| Measurement | Tohono O'odham | Central American |
| Minimum | 13.0% | 55.9% |
| Maximum | 100.0% | 100.0% |
| Range | 87.0% | 44.1% |
| Mean | 67.2% | 83.8% |
| Median | 72.2% | 83.7% |
| Interquartile 25% (IQ1) | 57.8% | 82.4% |
| Interquartile 75% (IQ3) | 78.1% | 85.7% |
| Interquartile Range (IQR) | 20.3% | 3.3% |
| Standard Deviation (Sample) | 19.2% | 5.9% |
| Standard Deviation (Population) | 18.8% | 5.8% |
Similar Demographics by In Labor Force | Age 35-44
Demographics Similar to Tohono O'odham by In Labor Force | Age 35-44
In terms of in labor force | age 35-44, the demographic groups most similar to Tohono O'odham are Navajo (73.8%, a difference of 0.38%), Yuman (74.7%, a difference of 0.83%), Pima (74.8%, a difference of 0.96%), Immigrants from Yemen (76.3%, a difference of 2.9%), and Crow (76.5%, a difference of 3.2%).
| Demographics | Rating | Rank | In Labor Force | Age 35-44 |
| Kiowa | 0.0 /100 | #333 | Tragic 79.2% |
| Yakama | 0.0 /100 | #334 | Tragic 79.0% |
| Natives/Alaskans | 0.0 /100 | #335 | Tragic 78.9% |
| Arapaho | 0.0 /100 | #336 | Tragic 78.1% |
| Apache | 0.0 /100 | #337 | Tragic 77.9% |
| Pueblo | 0.0 /100 | #338 | Tragic 77.4% |
| Yup'ik | 0.0 /100 | #339 | Tragic 77.3% |
| Lumbee | 0.0 /100 | #340 | Tragic 77.0% |
| Hopi | 0.0 /100 | #341 | Tragic 77.0% |
| Crow | 0.0 /100 | #342 | Tragic 76.5% |
| Immigrants | Yemen | 0.0 /100 | #343 | Tragic 76.3% |
| Pima | 0.0 /100 | #344 | Tragic 74.8% |
| Yuman | 0.0 /100 | #345 | Tragic 74.7% |
| Tohono O'odham | 0.0 /100 | #346 | Tragic 74.1% |
| Navajo | 0.0 /100 | #347 | Tragic 73.8% |
Demographics Similar to Central Americans by In Labor Force | Age 35-44
In terms of in labor force | age 35-44, the demographic groups most similar to Central Americans are Scotch-Irish (83.5%, a difference of 0.010%), Iroquois (83.5%, a difference of 0.040%), Spaniard (83.4%, a difference of 0.040%), Immigrants from Congo (83.5%, a difference of 0.060%), and Vietnamese (83.5%, a difference of 0.070%).
| Demographics | Rating | Rank | In Labor Force | Age 35-44 |
| Tsimshian | 0.2 /100 | #258 | Tragic 83.5% |
| Immigrants | El Salvador | 0.2 /100 | #259 | Tragic 83.5% |
| Vietnamese | 0.2 /100 | #260 | Tragic 83.5% |
| Immigrants | Dominica | 0.2 /100 | #261 | Tragic 83.5% |
| Immigrants | Congo | 0.2 /100 | #262 | Tragic 83.5% |
| Iroquois | 0.2 /100 | #263 | Tragic 83.5% |
| Scotch-Irish | 0.1 /100 | #264 | Tragic 83.5% |
| Central Americans | 0.1 /100 | #265 | Tragic 83.5% |
| Spaniards | 0.1 /100 | #266 | Tragic 83.4% |
| Guamanians/Chamorros | 0.1 /100 | #267 | Tragic 83.4% |
| Hondurans | 0.1 /100 | #268 | Tragic 83.4% |
| Immigrants | Grenada | 0.1 /100 | #269 | Tragic 83.3% |
| Immigrants | Honduras | 0.0 /100 | #270 | Tragic 83.3% |
| French American Indians | 0.0 /100 | #271 | Tragic 83.2% |
| Immigrants | Fiji | 0.0 /100 | #272 | Tragic 83.2% |