Immigrants from Ghana vs Central American In Labor Force | Age 35-44

COMPARE

Immigrants from Ghana
Race
Ancestry
AfghanAfricanAlaska NativeAlaskan AthabascanAlbanianAleutAlsatianAmericanApacheArabArapahoArgentineanArmenianAssyrian/Chaldean/SyriacAustralianAustrianBahamianBangladeshiBarbadianBasqueBelgianBelizeanBermudanBhutaneseBlackfeetBolivianBrazilianBritishBritish West IndianBulgarianBurmeseCajunCambodianCanadianCape VerdeanCarpatho RusynCelticCentral American IndianCherokeeCheyenneChickasawChileanChineseChippewaChoctawColombianColvilleComancheCosta RicanCreeCreekCroatianCrowCubanCypriotCzechCzechoslovakianDanishDelawareDominicanDutchDutch West IndianEastern EuropeanEcuadorianEgyptianEnglishEstonianEthiopianEuropeanFijianFilipinoFinnishFrenchFrench American IndianFrench CanadianGermanGerman RussianGhanaianGreekGuamanian/ChamorroGuatemalanGuyaneseHaitianHmongHonduranHopiHoumaHungarianIcelanderIndian (Asian)IndonesianInupiatIranianIraqiIrishIroquoisIsraeliItalianJamaicanJapaneseJordanianKenyanKiowaKoreanLaotianLatvianLebaneseLiberianLithuanianLumbeeLuxembourgerMacedonianMalaysianMalteseMarshalleseMenomineeMexicanMexican American IndianMongolianMoroccanNative HawaiianNavajoNepaleseNew ZealanderNicaraguanNigerianNorthern EuropeanNorwegianOkinawanOsageOttawaPaiutePakistaniPalestinianPanamanianParaguayanPennsylvania GermanPeruvianPimaPolishPortuguesePotawatomiPuebloPuerto RicanPuget Sound SalishRomanianRussianSalvadoranSamoanScandinavianScotch-IrishScottishSeminoleSenegaleseSerbianShoshoneSierra LeoneanSiouxSlavicSlovakSloveneSomaliSouth AfricanSouth AmericanSouth American IndianSoviet UnionSpaniardSpanishSpanish AmericanSpanish American IndianSri LankanSubsaharan AfricanSudaneseSwedishSwissSyrianTaiwaneseThaiTlingit-HaidaTohono O'OdhamTonganTrinidadian and TobagonianTsimshianTurkishU.S. Virgin IslanderUgandanUkrainianUruguayanUteVenezuelanVietnameseWelshWest IndianYakamaYaquiYugoslavianYumanYup'ikZimbabwean
Immigration
NonimmigrantsImmigrantsAfghanistanAfricaAlbaniaArgentinaArmeniaAsiaAustraliaAustriaBahamasBangladeshBarbadosBelarusBelgiumBelizeBoliviaBosnia and HerzegovinaBrazilBulgariaBurma/MyanmarCabo VerdeCambodiaCameroonCanadaCaribbeanCentral AmericaChileChinaColombiaCongoCosta RicaCroatiaCubaCzechoslovakiaDenmarkDominicaDominican RepublicEastern AfricaEastern AsiaEastern EuropeEcuadorEgyptEl SalvadorEnglandEritreaEthiopiaEuropeFijiFranceGermanyGhanaGreeceGrenadaGuatemalaGuyanaHaitiHondurasHong KongHungaryIndiaIndonesiaIranIraqIrelandIsraelItalyJamaicaJapanJordanKazakhstanKenyaKoreaKuwaitLaosLatin AmericaLatviaLebanonLiberiaLithuaniaMalaysiaMexicoMicronesiaMiddle AfricaMoldovaMoroccoNepalNetherlandsNicaraguaNigeriaNorth AmericaNorth MacedoniaNorthern AfricaNorthern EuropeNorwayOceaniaPakistanPanamaPeruPhilippinesPolandPortugalRomaniaRussiaSaudi ArabiaScotlandSenegalSerbiaSierra LeoneSingaporeSomaliaSouth AfricaSouth AmericaSouth Central AsiaSouth Eastern AsiaSouthern EuropeSpainSri LankaSt. Vincent and the GrenadinesSudanSwedenSwitzerlandSyriaTaiwanThailandTrinidad and TobagoTurkeyUgandaUkraineUruguayUzbekistanVenezuelaVietnamWest IndiesWestern AfricaWestern AsiaWestern EuropeYemenZaireZimbabweAzores
Central American
Race
Ancestry
AfghanAfricanAlaska NativeAlaskan AthabascanAlbanianAleutAlsatianAmericanApacheArabArapahoArgentineanArmenianAssyrian/Chaldean/SyriacAustralianAustrianBahamianBangladeshiBarbadianBasqueBelgianBelizeanBermudanBhutaneseBlackfeetBolivianBrazilianBritishBritish West IndianBulgarianBurmeseCajunCambodianCanadianCape VerdeanCarpatho RusynCelticCentral AmericanCentral American IndianCherokeeCheyenneChickasawChileanChineseChippewaChoctawColombianColvilleComancheCosta RicanCreeCreekCroatianCrowCubanCypriotCzechCzechoslovakianDanishDelawareDominicanDutchDutch West IndianEastern EuropeanEcuadorianEgyptianEnglishEstonianEthiopianEuropeanFijianFilipinoFinnishFrenchFrench American IndianFrench CanadianGermanGerman RussianGhanaianGreekGuamanian/ChamorroGuatemalanGuyaneseHaitianHmongHonduranHopiHoumaHungarianIcelanderIndian (Asian)IndonesianInupiatIranianIraqiIrishIroquoisIsraeliItalianJamaicanJapaneseJordanianKenyanKiowaKoreanLaotianLatvianLebaneseLiberianLithuanianLumbeeLuxembourgerMacedonianMalaysianMalteseMarshalleseMenomineeMexicanMexican American IndianMongolianMoroccanNative HawaiianNavajoNepaleseNew ZealanderNicaraguanNigerianNorthern EuropeanNorwegianOkinawanOsageOttawaPaiutePakistaniPalestinianPanamanianParaguayanPennsylvania GermanPeruvianPimaPolishPortuguesePotawatomiPuebloPuerto RicanPuget Sound SalishRomanianRussianSalvadoranSamoanScandinavianScotch-IrishScottishSeminoleSenegaleseSerbianShoshoneSierra LeoneanSiouxSlavicSlovakSloveneSomaliSouth AfricanSouth AmericanSouth American IndianSoviet UnionSpaniardSpanishSpanish AmericanSpanish American IndianSri LankanSubsaharan AfricanSudaneseSwedishSwissSyrianTaiwaneseThaiTlingit-HaidaTohono O'OdhamTonganTrinidadian and TobagonianTsimshianTurkishU.S. Virgin IslanderUgandanUkrainianUruguayanUteVenezuelanVietnameseWelshWest IndianYakamaYaquiYugoslavianYumanYup'ikZimbabwean
Immigration
NonimmigrantsImmigrantsAfghanistanAfricaAlbaniaArgentinaArmeniaAsiaAustraliaAustriaBahamasBangladeshBarbadosBelarusBelgiumBelizeBoliviaBosnia and HerzegovinaBrazilBulgariaBurma/MyanmarCabo VerdeCambodiaCameroonCanadaCaribbeanCentral AmericaChileChinaColombiaCongoCosta RicaCroatiaCubaCzechoslovakiaDenmarkDominicaDominican RepublicEastern AfricaEastern AsiaEastern EuropeEcuadorEgyptEl SalvadorEnglandEritreaEthiopiaEuropeFijiFranceGermanyGreeceGrenadaGuatemalaGuyanaHaitiHondurasHong KongHungaryIndiaIndonesiaIranIraqIrelandIsraelItalyJamaicaJapanJordanKazakhstanKenyaKoreaKuwaitLaosLatin AmericaLatviaLebanonLiberiaLithuaniaMalaysiaMexicoMicronesiaMiddle AfricaMoldovaMoroccoNepalNetherlandsNicaraguaNigeriaNorth AmericaNorth MacedoniaNorthern AfricaNorthern EuropeNorwayOceaniaPakistanPanamaPeruPhilippinesPolandPortugalRomaniaRussiaSaudi ArabiaScotlandSenegalSerbiaSierra LeoneSingaporeSomaliaSouth AfricaSouth AmericaSouth Central AsiaSouth Eastern AsiaSouthern EuropeSpainSri LankaSt. Vincent and the GrenadinesSudanSwedenSwitzerlandSyriaTaiwanThailandTrinidad and TobagoTurkeyUgandaUkraineUruguayUzbekistanVenezuelaVietnamWest IndiesWestern AfricaWestern AsiaWestern EuropeYemenZaireZimbabweAzores
In Labor Force | Age 35-44
Income
Poverty
Unemployment
Labor Participation
Family Structure
Vehicle Availability
Education Level
Disability

In Labor Force | Age 35-44 Comparison

Immigrants from Ghana

Central Americans

Exceptional
Tragic
84.7%
IN LABOR FORCE | AGE 35-44
90.4/ 100
METRIC RATING
128th/ 347
METRIC RANK
83.5%
IN LABOR FORCE | AGE 35-44
0.1/ 100
METRIC RATING
265th/ 347
METRIC RANK

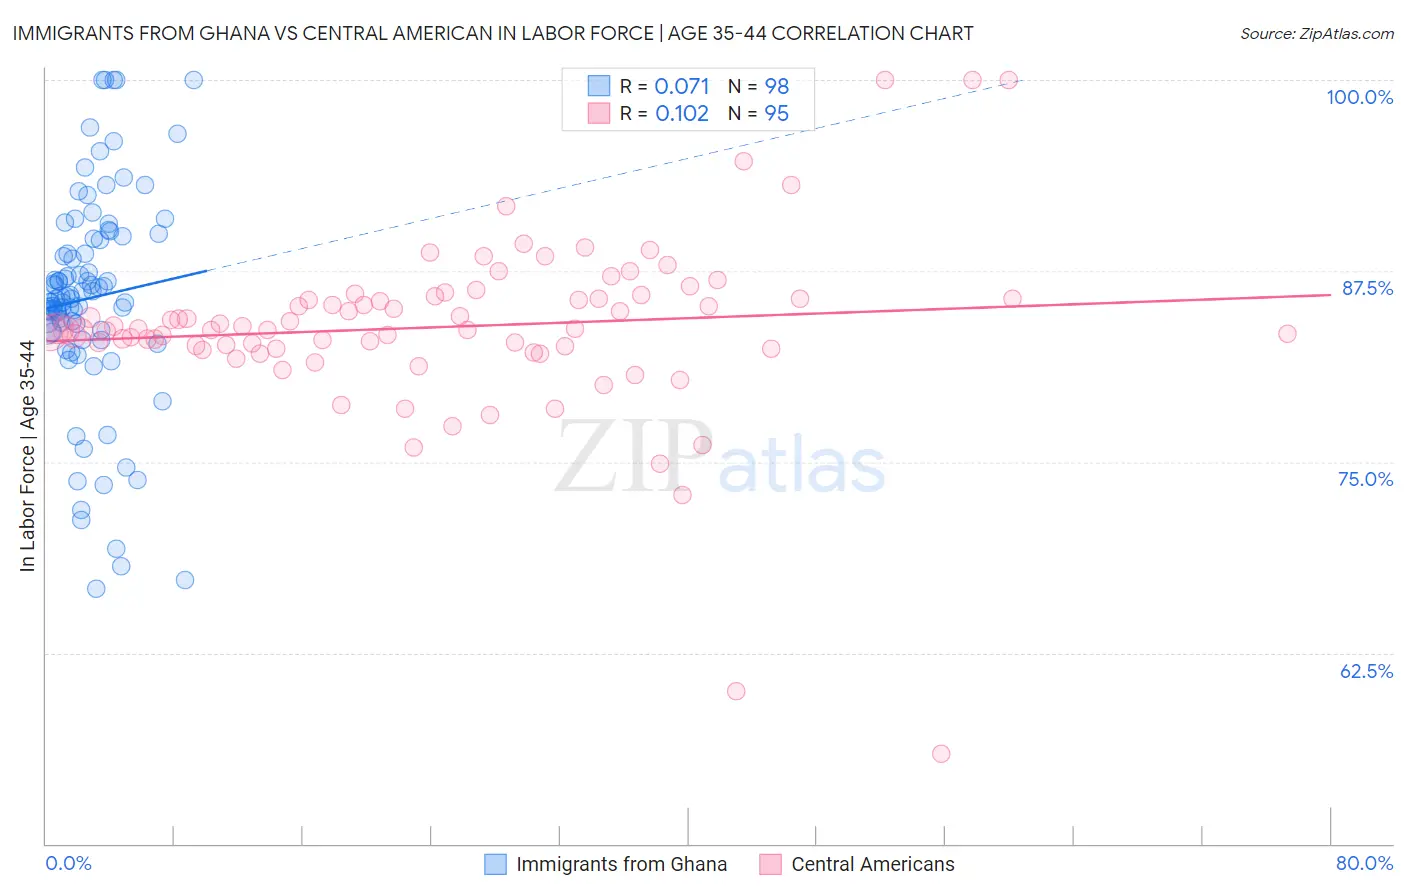
Immigrants from Ghana vs Central American In Labor Force | Age 35-44 Correlation Chart

The statistical analysis conducted on geographies consisting of 199,842,455 people shows a slight positive correlation between the proportion of Immigrants from Ghana and labor force participation rate among population between the ages 35 and 44 in the United States with a correlation coefficient (R) of 0.071 and weighted average of 84.7%. Similarly, the statistical analysis conducted on geographies consisting of 504,181,115 people shows a poor positive correlation between the proportion of Central Americans and labor force participation rate among population between the ages 35 and 44 in the United States with a correlation coefficient (R) of 0.102 and weighted average of 83.5%, a difference of 1.5%.
Immigrants from Ghana vs Central American In Labor Force | Age 35-44

In Labor Force | Age 35-44 Correlation Summary

MeasurementImmigrants from GhanaCentral American
Minimum66.7%55.9%
Maximum100.0%100.0%
Range33.3%44.1%
Mean85.7%83.8%
Median85.8%83.7%
Interquartile 25% (IQ1)83.6%82.4%
Interquartile 75% (IQ3)89.6%85.7%
Interquartile Range (IQR)6.0%3.3%
Standard Deviation (Sample)7.0%5.9%
Standard Deviation (Population)7.0%5.8%

Similar Demographics by In Labor Force | Age 35-44

Demographics Similar to Immigrants from Ghana by In Labor Force | Age 35-44

In terms of in labor force | age 35-44, the demographic groups most similar to Immigrants from Ghana are Asian (84.7%, a difference of 0.0%), Immigrants from Spain (84.7%, a difference of 0.0%), German (84.7%, a difference of 0.010%), Immigrants from South America (84.7%, a difference of 0.010%), and Slavic (84.7%, a difference of 0.010%).
DemographicsRating | RankIn Labor Force | Age 35-44
Finns
91.2
/100
|
#121
Exceptional
84.7%
Germans
91.0
/100
|
#122
Exceptional
84.7%
Immigrants | South America
90.9
/100
|
#123
Exceptional
84.7%
Slavs
90.8
/100
|
#124
Exceptional
84.7%
Maltese
90.8
/100
|
#125
Exceptional
84.7%
Asians
90.6
/100
|
#126
Exceptional
84.7%
Immigrants | Spain
90.6
/100
|
#127
Exceptional
84.7%
Immigrants | Ghana
90.4
/100
|
#128
Exceptional
84.7%
Palestinians
89.7
/100
|
#129
Excellent
84.7%
Bhutanese
89.7
/100
|
#130
Excellent
84.7%
Immigrants | Scotland
89.6
/100
|
#131
Excellent
84.7%
Austrians
89.4
/100
|
#132
Excellent
84.7%
Argentineans
88.4
/100
|
#133
Excellent
84.6%
Immigrants | Korea
88.2
/100
|
#134
Excellent
84.6%
Immigrants | Malaysia
87.5
/100
|
#135
Excellent
84.6%

Demographics Similar to Central Americans by In Labor Force | Age 35-44

In terms of in labor force | age 35-44, the demographic groups most similar to Central Americans are Scotch-Irish (83.5%, a difference of 0.010%), Iroquois (83.5%, a difference of 0.040%), Spaniard (83.4%, a difference of 0.040%), Immigrants from Congo (83.5%, a difference of 0.060%), and Vietnamese (83.5%, a difference of 0.070%).
DemographicsRating | RankIn Labor Force | Age 35-44
Tsimshian
0.2
/100
|
#258
Tragic
83.5%
Immigrants | El Salvador
0.2
/100
|
#259
Tragic
83.5%
Vietnamese
0.2
/100
|
#260
Tragic
83.5%
Immigrants | Dominica
0.2
/100
|
#261
Tragic
83.5%
Immigrants | Congo
0.2
/100
|
#262
Tragic
83.5%
Iroquois
0.2
/100
|
#263
Tragic
83.5%
Scotch-Irish
0.1
/100
|
#264
Tragic
83.5%
Central Americans
0.1
/100
|
#265
Tragic
83.5%
Spaniards
0.1
/100
|
#266
Tragic
83.4%
Guamanians/Chamorros
0.1
/100
|
#267
Tragic
83.4%
Hondurans
0.1
/100
|
#268
Tragic
83.4%
Immigrants | Grenada
0.1
/100
|
#269
Tragic
83.3%
Immigrants | Honduras
0.0
/100
|
#270
Tragic
83.3%
French American Indians
0.0
/100
|
#271
Tragic
83.2%
Immigrants | Fiji
0.0
/100
|
#272
Tragic
83.2%