Iroquois vs Central American In Labor Force | Age 35-44
COMPARE
Iroquois
Central American
In Labor Force | Age 35-44
In Labor Force | Age 35-44 Comparison
Iroquois
Central Americans
83.5%
IN LABOR FORCE | AGE 35-44
0.2/ 100
METRIC RATING
263rd/ 347
METRIC RANK
83.5%
IN LABOR FORCE | AGE 35-44
0.1/ 100
METRIC RATING
265th/ 347
METRIC RANK
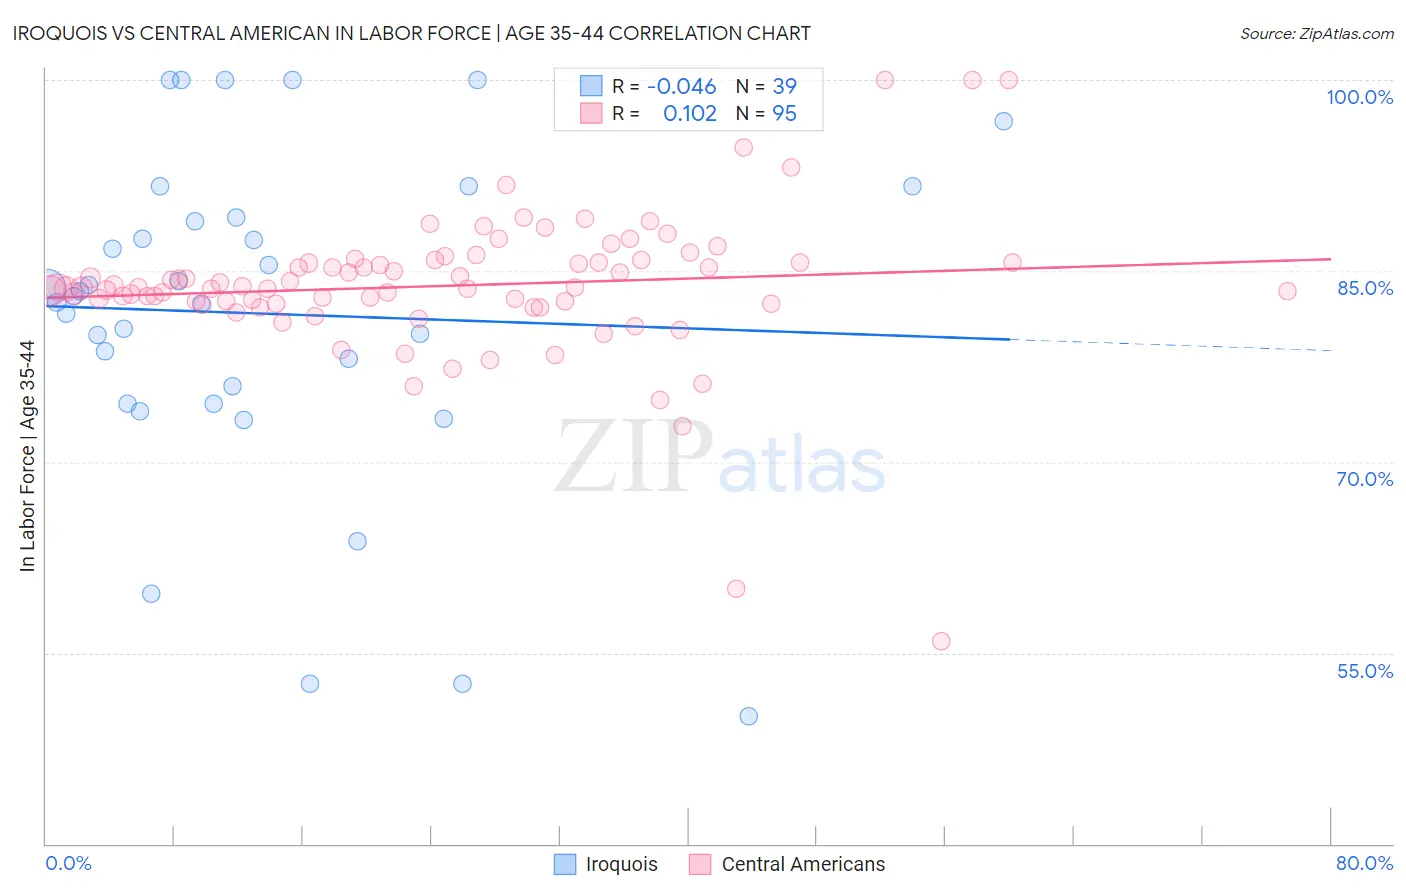
Iroquois vs Central American In Labor Force | Age 35-44 Correlation Chart
The statistical analysis conducted on geographies consisting of 207,246,504 people shows no correlation between the proportion of Iroquois and labor force participation rate among population between the ages 35 and 44 in the United States with a correlation coefficient (R) of -0.046 and weighted average of 83.5%. Similarly, the statistical analysis conducted on geographies consisting of 504,181,115 people shows a poor positive correlation between the proportion of Central Americans and labor force participation rate among population between the ages 35 and 44 in the United States with a correlation coefficient (R) of 0.102 and weighted average of 83.5%, a difference of 0.040%.
In Labor Force | Age 35-44 Correlation Summary
| Measurement | Iroquois | Central American |
| Minimum | 50.0% | 55.9% |
| Maximum | 100.0% | 100.0% |
| Range | 50.0% | 44.1% |
| Mean | 81.6% | 83.8% |
| Median | 83.1% | 83.7% |
| Interquartile 25% (IQ1) | 74.6% | 82.4% |
| Interquartile 75% (IQ3) | 89.2% | 85.7% |
| Interquartile Range (IQR) | 14.6% | 3.3% |
| Standard Deviation (Sample) | 12.9% | 5.9% |
| Standard Deviation (Population) | 12.7% | 5.8% |
Demographics Similar to Iroquois and Central Americans by In Labor Force | Age 35-44
In terms of in labor force | age 35-44, the demographic groups most similar to Iroquois are Immigrants from Dominica (83.5%, a difference of 0.030%), Immigrants from Congo (83.5%, a difference of 0.030%), Scotch-Irish (83.5%, a difference of 0.030%), Vietnamese (83.5%, a difference of 0.040%), and Immigrants from El Salvador (83.5%, a difference of 0.050%). Similarly, the demographic groups most similar to Central Americans are Scotch-Irish (83.5%, a difference of 0.010%), Spaniard (83.4%, a difference of 0.040%), Immigrants from Congo (83.5%, a difference of 0.060%), Vietnamese (83.5%, a difference of 0.070%), and Immigrants from Dominica (83.5%, a difference of 0.070%).
| Demographics | Rating | Rank | In Labor Force | Age 35-44 |
| Tongans | 0.4 /100 | #254 | Tragic 83.6% |
| Immigrants | Azores | 0.3 /100 | #255 | Tragic 83.6% |
| Japanese | 0.3 /100 | #256 | Tragic 83.6% |
| Basques | 0.3 /100 | #257 | Tragic 83.6% |
| Tsimshian | 0.2 /100 | #258 | Tragic 83.5% |
| Immigrants | El Salvador | 0.2 /100 | #259 | Tragic 83.5% |
| Vietnamese | 0.2 /100 | #260 | Tragic 83.5% |
| Immigrants | Dominica | 0.2 /100 | #261 | Tragic 83.5% |
| Immigrants | Congo | 0.2 /100 | #262 | Tragic 83.5% |
| Iroquois | 0.2 /100 | #263 | Tragic 83.5% |
| Scotch-Irish | 0.1 /100 | #264 | Tragic 83.5% |
| Central Americans | 0.1 /100 | #265 | Tragic 83.5% |
| Spaniards | 0.1 /100 | #266 | Tragic 83.4% |
| Guamanians/Chamorros | 0.1 /100 | #267 | Tragic 83.4% |
| Hondurans | 0.1 /100 | #268 | Tragic 83.4% |
| Immigrants | Grenada | 0.1 /100 | #269 | Tragic 83.3% |
| Immigrants | Honduras | 0.0 /100 | #270 | Tragic 83.3% |
| French American Indians | 0.0 /100 | #271 | Tragic 83.2% |
| Immigrants | Fiji | 0.0 /100 | #272 | Tragic 83.2% |
| Spanish | 0.0 /100 | #273 | Tragic 83.2% |
| Immigrants | Nonimmigrants | 0.0 /100 | #274 | Tragic 83.2% |