Immigrants from Bahamas vs Central American In Labor Force | Age 35-44
COMPARE
Immigrants from Bahamas
Central American
In Labor Force | Age 35-44
In Labor Force | Age 35-44 Comparison
Immigrants from Bahamas
Central Americans
84.8%
IN LABOR FORCE | AGE 35-44
94.8/ 100
METRIC RATING
106th/ 347
METRIC RANK
83.5%
IN LABOR FORCE | AGE 35-44
0.1/ 100
METRIC RATING
265th/ 347
METRIC RANK
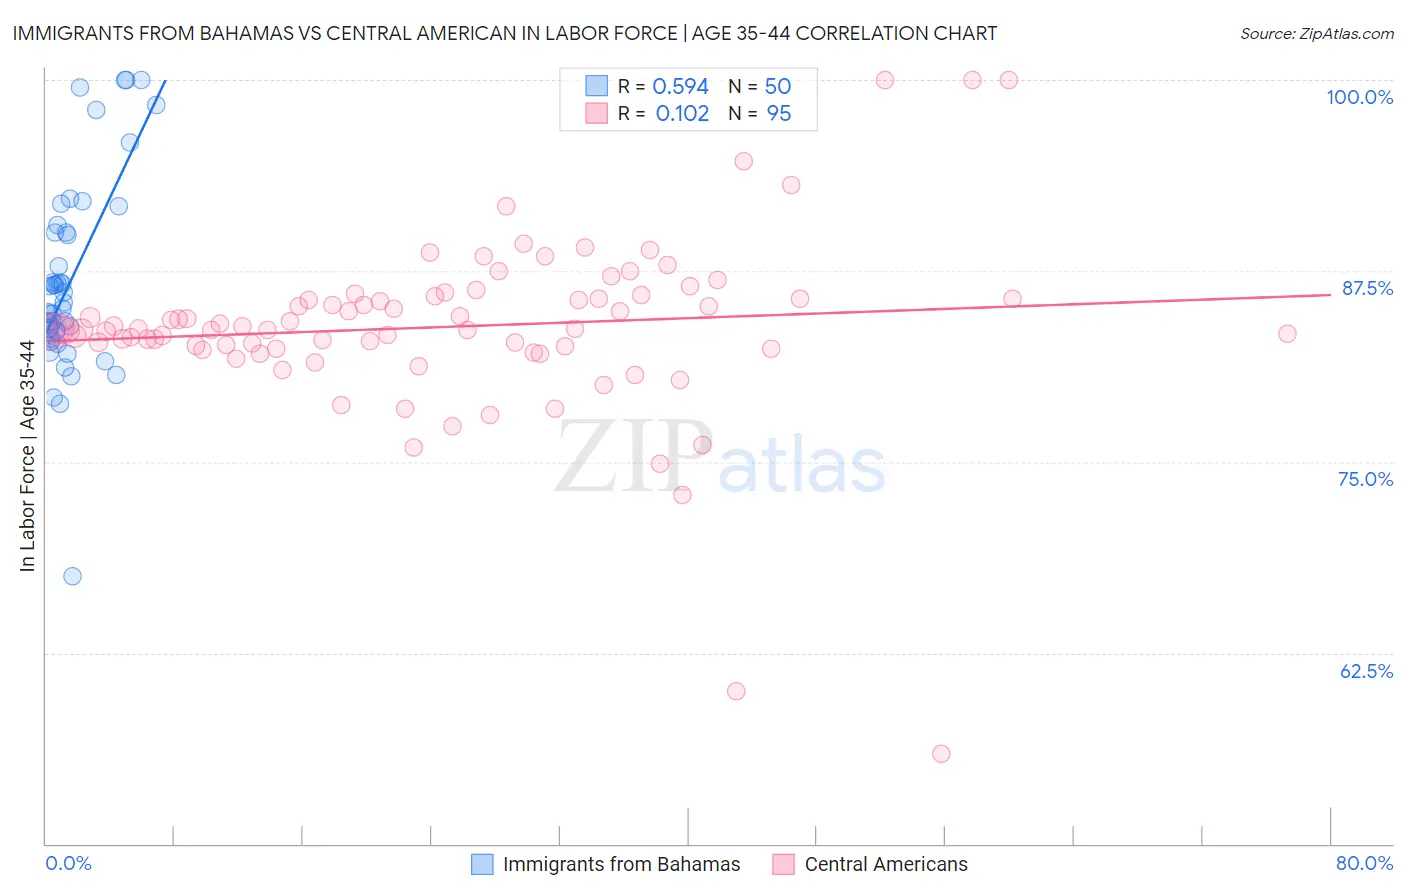
Immigrants from Bahamas vs Central American In Labor Force | Age 35-44 Correlation Chart
The statistical analysis conducted on geographies consisting of 104,601,766 people shows a substantial positive correlation between the proportion of Immigrants from Bahamas and labor force participation rate among population between the ages 35 and 44 in the United States with a correlation coefficient (R) of 0.594 and weighted average of 84.8%. Similarly, the statistical analysis conducted on geographies consisting of 504,181,115 people shows a poor positive correlation between the proportion of Central Americans and labor force participation rate among population between the ages 35 and 44 in the United States with a correlation coefficient (R) of 0.102 and weighted average of 83.5%, a difference of 1.6%.
In Labor Force | Age 35-44 Correlation Summary
| Measurement | Immigrants from Bahamas | Central American |
| Minimum | 67.5% | 55.9% |
| Maximum | 100.0% | 100.0% |
| Range | 32.5% | 44.1% |
| Mean | 86.8% | 83.8% |
| Median | 85.2% | 83.7% |
| Interquartile 25% (IQ1) | 83.5% | 82.4% |
| Interquartile 75% (IQ3) | 90.0% | 85.7% |
| Interquartile Range (IQR) | 6.5% | 3.3% |
| Standard Deviation (Sample) | 6.4% | 5.9% |
| Standard Deviation (Population) | 6.3% | 5.8% |
Similar Demographics by In Labor Force | Age 35-44
Demographics Similar to Immigrants from Bahamas by In Labor Force | Age 35-44
In terms of in labor force | age 35-44, the demographic groups most similar to Immigrants from Bahamas are Immigrants from Romania (84.8%, a difference of 0.0%), Immigrants from Belarus (84.8%, a difference of 0.010%), Immigrants from Sweden (84.8%, a difference of 0.010%), South American (84.8%, a difference of 0.010%), and Immigrants from Argentina (84.8%, a difference of 0.010%).
| Demographics | Rating | Rank | In Labor Force | Age 35-44 |
| Haitians | 96.0 /100 | #99 | Exceptional 84.8% |
| Immigrants | Czechoslovakia | 95.9 /100 | #100 | Exceptional 84.8% |
| Immigrants | Australia | 95.5 /100 | #101 | Exceptional 84.8% |
| Immigrants | Southern Europe | 95.3 /100 | #102 | Exceptional 84.8% |
| Immigrants | Belarus | 95.3 /100 | #103 | Exceptional 84.8% |
| Immigrants | Sweden | 95.2 /100 | #104 | Exceptional 84.8% |
| South Americans | 95.0 /100 | #105 | Exceptional 84.8% |
| Immigrants | Bahamas | 94.8 /100 | #106 | Exceptional 84.8% |
| Immigrants | Romania | 94.7 /100 | #107 | Exceptional 84.8% |
| Immigrants | Argentina | 94.5 /100 | #108 | Exceptional 84.8% |
| Immigrants | Russia | 94.5 /100 | #109 | Exceptional 84.8% |
| Filipinos | 93.8 /100 | #110 | Exceptional 84.7% |
| Ukrainians | 93.5 /100 | #111 | Exceptional 84.7% |
| Immigrants | Western Africa | 93.4 /100 | #112 | Exceptional 84.7% |
| Uruguayans | 93.3 /100 | #113 | Exceptional 84.7% |
Demographics Similar to Central Americans by In Labor Force | Age 35-44
In terms of in labor force | age 35-44, the demographic groups most similar to Central Americans are Scotch-Irish (83.5%, a difference of 0.010%), Iroquois (83.5%, a difference of 0.040%), Spaniard (83.4%, a difference of 0.040%), Immigrants from Congo (83.5%, a difference of 0.060%), and Vietnamese (83.5%, a difference of 0.070%).
| Demographics | Rating | Rank | In Labor Force | Age 35-44 |
| Tsimshian | 0.2 /100 | #258 | Tragic 83.5% |
| Immigrants | El Salvador | 0.2 /100 | #259 | Tragic 83.5% |
| Vietnamese | 0.2 /100 | #260 | Tragic 83.5% |
| Immigrants | Dominica | 0.2 /100 | #261 | Tragic 83.5% |
| Immigrants | Congo | 0.2 /100 | #262 | Tragic 83.5% |
| Iroquois | 0.2 /100 | #263 | Tragic 83.5% |
| Scotch-Irish | 0.1 /100 | #264 | Tragic 83.5% |
| Central Americans | 0.1 /100 | #265 | Tragic 83.5% |
| Spaniards | 0.1 /100 | #266 | Tragic 83.4% |
| Guamanians/Chamorros | 0.1 /100 | #267 | Tragic 83.4% |
| Hondurans | 0.1 /100 | #268 | Tragic 83.4% |
| Immigrants | Grenada | 0.1 /100 | #269 | Tragic 83.3% |
| Immigrants | Honduras | 0.0 /100 | #270 | Tragic 83.3% |
| French American Indians | 0.0 /100 | #271 | Tragic 83.2% |
| Immigrants | Fiji | 0.0 /100 | #272 | Tragic 83.2% |