Swiss vs Argentinean In Labor Force | Age 35-44
COMPARE
Swiss
Argentinean
In Labor Force | Age 35-44
In Labor Force | Age 35-44 Comparison
Swiss
Argentineans
84.2%
IN LABOR FORCE | AGE 35-44
17.4/ 100
METRIC RATING
209th/ 347
METRIC RANK
84.6%
IN LABOR FORCE | AGE 35-44
88.4/ 100
METRIC RATING
133rd/ 347
METRIC RANK
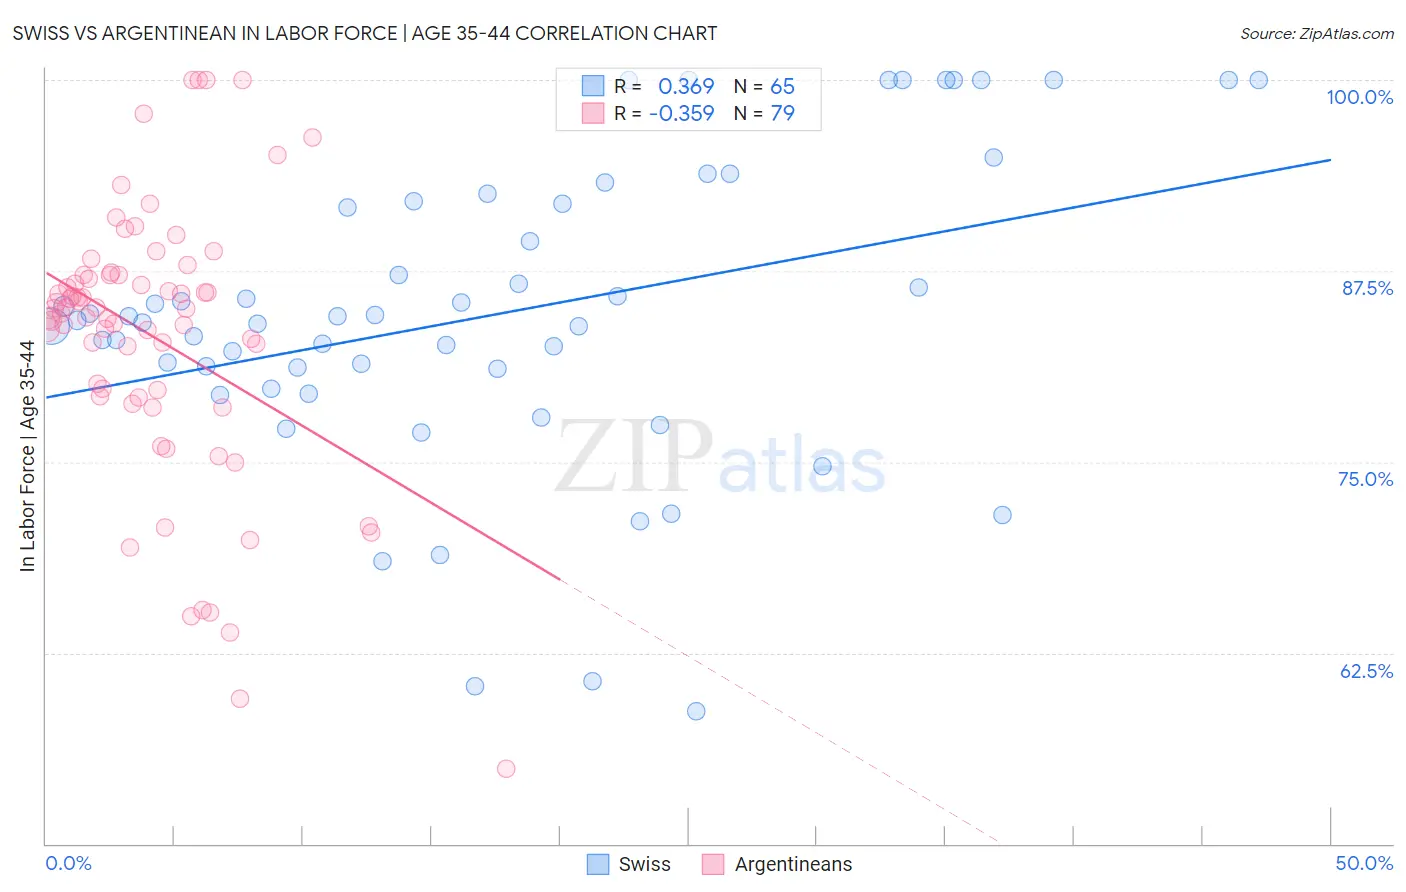
Swiss vs Argentinean In Labor Force | Age 35-44 Correlation Chart
The statistical analysis conducted on geographies consisting of 464,764,529 people shows a mild positive correlation between the proportion of Swiss and labor force participation rate among population between the ages 35 and 44 in the United States with a correlation coefficient (R) of 0.369 and weighted average of 84.2%. Similarly, the statistical analysis conducted on geographies consisting of 297,032,479 people shows a mild negative correlation between the proportion of Argentineans and labor force participation rate among population between the ages 35 and 44 in the United States with a correlation coefficient (R) of -0.359 and weighted average of 84.6%, a difference of 0.58%.
In Labor Force | Age 35-44 Correlation Summary
| Measurement | Swiss | Argentinean |
| Minimum | 58.7% | 54.9% |
| Maximum | 100.0% | 100.0% |
| Range | 41.3% | 45.1% |
| Mean | 84.7% | 83.2% |
| Median | 84.3% | 85.0% |
| Interquartile 25% (IQ1) | 80.4% | 79.3% |
| Interquartile 75% (IQ3) | 92.0% | 87.2% |
| Interquartile Range (IQR) | 11.6% | 8.0% |
| Standard Deviation (Sample) | 9.9% | 9.0% |
| Standard Deviation (Population) | 9.9% | 8.9% |
Similar Demographics by In Labor Force | Age 35-44
Demographics Similar to Swiss by In Labor Force | Age 35-44
In terms of in labor force | age 35-44, the demographic groups most similar to Swiss are Immigrants from North America (84.2%, a difference of 0.010%), New Zealander (84.1%, a difference of 0.010%), Immigrants from Canada (84.2%, a difference of 0.020%), Immigrants from Costa Rica (84.2%, a difference of 0.020%), and Laotian (84.2%, a difference of 0.020%).
| Demographics | Rating | Rank | In Labor Force | Age 35-44 |
| Immigrants | Uzbekistan | 22.8 /100 | #202 | Fair 84.2% |
| Immigrants | South Eastern Asia | 22.4 /100 | #203 | Fair 84.2% |
| Canadians | 19.9 /100 | #204 | Poor 84.2% |
| Immigrants | Canada | 19.6 /100 | #205 | Poor 84.2% |
| Immigrants | Costa Rica | 19.5 /100 | #206 | Poor 84.2% |
| Laotians | 19.0 /100 | #207 | Poor 84.2% |
| Immigrants | North America | 18.1 /100 | #208 | Poor 84.2% |
| Swiss | 17.4 /100 | #209 | Poor 84.2% |
| New Zealanders | 16.2 /100 | #210 | Poor 84.1% |
| Immigrants | Ecuador | 15.2 /100 | #211 | Poor 84.1% |
| Israelis | 14.0 /100 | #212 | Poor 84.1% |
| Bangladeshis | 13.7 /100 | #213 | Poor 84.1% |
| Immigrants | Barbados | 13.2 /100 | #214 | Poor 84.1% |
| Europeans | 12.2 /100 | #215 | Poor 84.1% |
| Nicaraguans | 12.1 /100 | #216 | Poor 84.1% |
Demographics Similar to Argentineans by In Labor Force | Age 35-44
In terms of in labor force | age 35-44, the demographic groups most similar to Argentineans are Immigrants from Korea (84.6%, a difference of 0.0%), Immigrants from Malaysia (84.6%, a difference of 0.010%), Palestinian (84.7%, a difference of 0.020%), Bhutanese (84.7%, a difference of 0.020%), and Immigrants from Scotland (84.7%, a difference of 0.020%).
| Demographics | Rating | Rank | In Labor Force | Age 35-44 |
| Asians | 90.6 /100 | #126 | Exceptional 84.7% |
| Immigrants | Spain | 90.6 /100 | #127 | Exceptional 84.7% |
| Immigrants | Ghana | 90.4 /100 | #128 | Exceptional 84.7% |
| Palestinians | 89.7 /100 | #129 | Excellent 84.7% |
| Bhutanese | 89.7 /100 | #130 | Excellent 84.7% |
| Immigrants | Scotland | 89.6 /100 | #131 | Excellent 84.7% |
| Austrians | 89.4 /100 | #132 | Excellent 84.7% |
| Argentineans | 88.4 /100 | #133 | Excellent 84.6% |
| Immigrants | Korea | 88.2 /100 | #134 | Excellent 84.6% |
| Immigrants | Malaysia | 87.5 /100 | #135 | Excellent 84.6% |
| Afghans | 86.3 /100 | #136 | Excellent 84.6% |
| Immigrants | Chile | 84.6 /100 | #137 | Excellent 84.6% |
| Czechoslovakians | 82.6 /100 | #138 | Excellent 84.6% |
| Immigrants | Zaire | 82.5 /100 | #139 | Excellent 84.6% |
| Immigrants | Japan | 81.4 /100 | #140 | Excellent 84.6% |