Swiss vs Jordanian In Labor Force | Age 35-44
COMPARE
Swiss
Jordanian
In Labor Force | Age 35-44
In Labor Force | Age 35-44 Comparison
Swiss
Jordanians
84.2%
IN LABOR FORCE | AGE 35-44
17.4/ 100
METRIC RATING
209th/ 347
METRIC RANK
84.4%
IN LABOR FORCE | AGE 35-44
51.7/ 100
METRIC RATING
171st/ 347
METRIC RANK
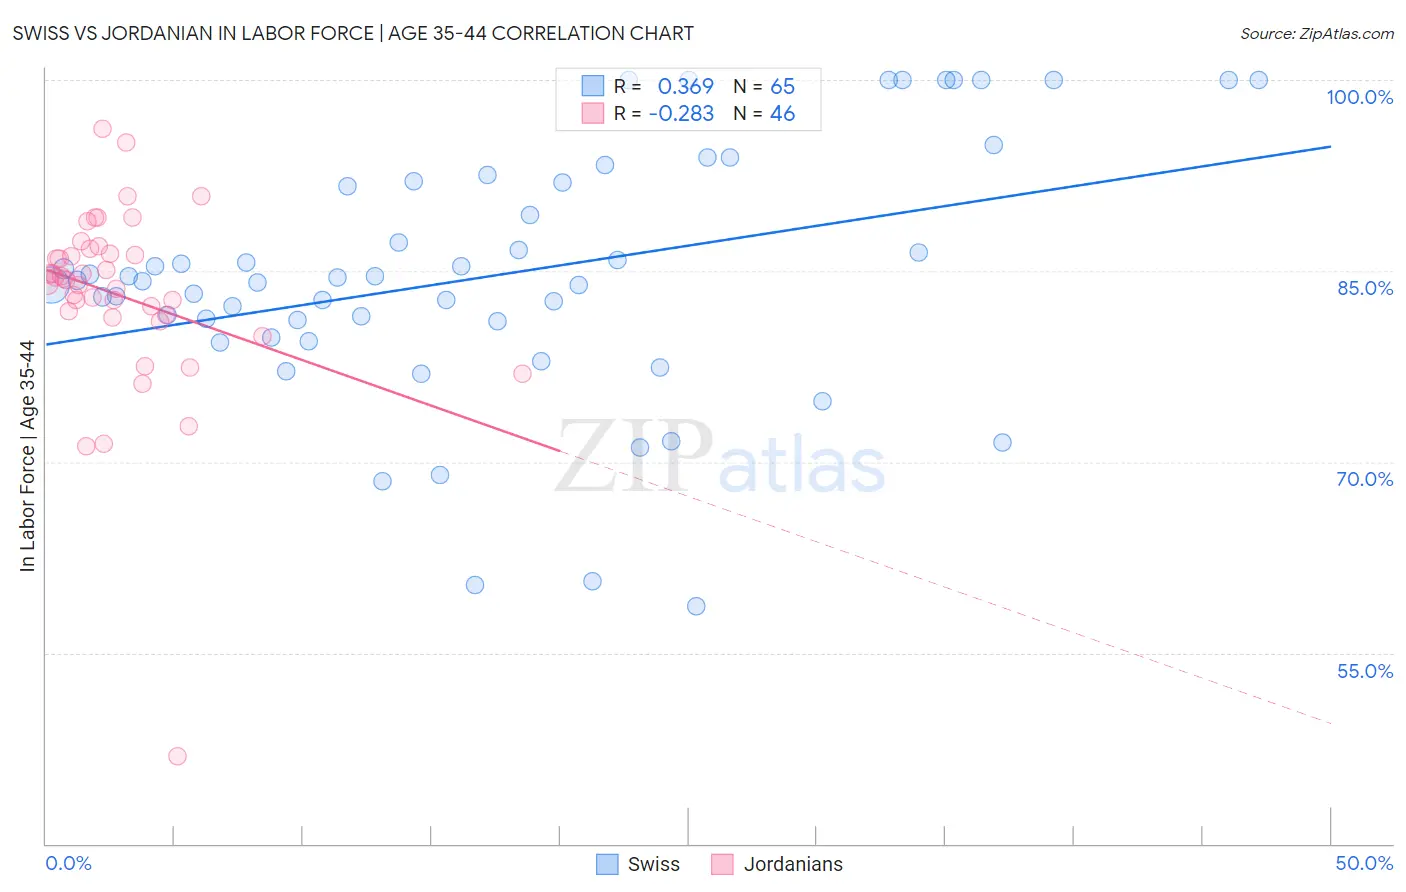
Swiss vs Jordanian In Labor Force | Age 35-44 Correlation Chart
The statistical analysis conducted on geographies consisting of 464,764,529 people shows a mild positive correlation between the proportion of Swiss and labor force participation rate among population between the ages 35 and 44 in the United States with a correlation coefficient (R) of 0.369 and weighted average of 84.2%. Similarly, the statistical analysis conducted on geographies consisting of 166,398,743 people shows a weak negative correlation between the proportion of Jordanians and labor force participation rate among population between the ages 35 and 44 in the United States with a correlation coefficient (R) of -0.283 and weighted average of 84.4%, a difference of 0.26%.
In Labor Force | Age 35-44 Correlation Summary
| Measurement | Swiss | Jordanian |
| Minimum | 58.7% | 46.9% |
| Maximum | 100.0% | 96.2% |
| Range | 41.3% | 49.3% |
| Mean | 84.7% | 83.1% |
| Median | 84.3% | 84.3% |
| Interquartile 25% (IQ1) | 80.4% | 81.5% |
| Interquartile 75% (IQ3) | 92.0% | 86.3% |
| Interquartile Range (IQR) | 11.6% | 4.8% |
| Standard Deviation (Sample) | 9.9% | 7.5% |
| Standard Deviation (Population) | 9.9% | 7.5% |
Similar Demographics by In Labor Force | Age 35-44
Demographics Similar to Swiss by In Labor Force | Age 35-44
In terms of in labor force | age 35-44, the demographic groups most similar to Swiss are Immigrants from North America (84.2%, a difference of 0.010%), New Zealander (84.1%, a difference of 0.010%), Immigrants from Canada (84.2%, a difference of 0.020%), Immigrants from Costa Rica (84.2%, a difference of 0.020%), and Laotian (84.2%, a difference of 0.020%).
| Demographics | Rating | Rank | In Labor Force | Age 35-44 |
| Immigrants | Uzbekistan | 22.8 /100 | #202 | Fair 84.2% |
| Immigrants | South Eastern Asia | 22.4 /100 | #203 | Fair 84.2% |
| Canadians | 19.9 /100 | #204 | Poor 84.2% |
| Immigrants | Canada | 19.6 /100 | #205 | Poor 84.2% |
| Immigrants | Costa Rica | 19.5 /100 | #206 | Poor 84.2% |
| Laotians | 19.0 /100 | #207 | Poor 84.2% |
| Immigrants | North America | 18.1 /100 | #208 | Poor 84.2% |
| Swiss | 17.4 /100 | #209 | Poor 84.2% |
| New Zealanders | 16.2 /100 | #210 | Poor 84.1% |
| Immigrants | Ecuador | 15.2 /100 | #211 | Poor 84.1% |
| Israelis | 14.0 /100 | #212 | Poor 84.1% |
| Bangladeshis | 13.7 /100 | #213 | Poor 84.1% |
| Immigrants | Barbados | 13.2 /100 | #214 | Poor 84.1% |
| Europeans | 12.2 /100 | #215 | Poor 84.1% |
| Nicaraguans | 12.1 /100 | #216 | Poor 84.1% |
Demographics Similar to Jordanians by In Labor Force | Age 35-44
In terms of in labor force | age 35-44, the demographic groups most similar to Jordanians are Immigrants from Jordan (84.4%, a difference of 0.0%), Scandinavian (84.4%, a difference of 0.0%), Irish (84.4%, a difference of 0.010%), Immigrants from Afghanistan (84.4%, a difference of 0.010%), and Immigrants from Trinidad and Tobago (84.4%, a difference of 0.010%).
| Demographics | Rating | Rank | In Labor Force | Age 35-44 |
| Nigerians | 58.9 /100 | #164 | Average 84.4% |
| Venezuelans | 58.1 /100 | #165 | Average 84.4% |
| Alsatians | 55.2 /100 | #166 | Average 84.4% |
| Immigrants | Portugal | 55.2 /100 | #167 | Average 84.4% |
| Irish | 53.1 /100 | #168 | Average 84.4% |
| Immigrants | Afghanistan | 52.7 /100 | #169 | Average 84.4% |
| Immigrants | Jordan | 52.5 /100 | #170 | Average 84.4% |
| Jordanians | 51.7 /100 | #171 | Average 84.4% |
| Scandinavians | 51.2 /100 | #172 | Average 84.4% |
| Immigrants | Trinidad and Tobago | 50.7 /100 | #173 | Average 84.4% |
| Immigrants | Iran | 50.0 /100 | #174 | Average 84.4% |
| Pakistanis | 48.2 /100 | #175 | Average 84.4% |
| Sri Lankans | 47.3 /100 | #176 | Average 84.4% |
| French Canadians | 44.3 /100 | #177 | Average 84.3% |
| Northern Europeans | 44.1 /100 | #178 | Average 84.3% |