Swiss vs Palestinian In Labor Force | Age 35-44
COMPARE
Swiss
Palestinian
In Labor Force | Age 35-44
In Labor Force | Age 35-44 Comparison
Swiss
Palestinians
84.2%
IN LABOR FORCE | AGE 35-44
17.4/ 100
METRIC RATING
209th/ 347
METRIC RANK
84.7%
IN LABOR FORCE | AGE 35-44
89.7/ 100
METRIC RATING
129th/ 347
METRIC RANK
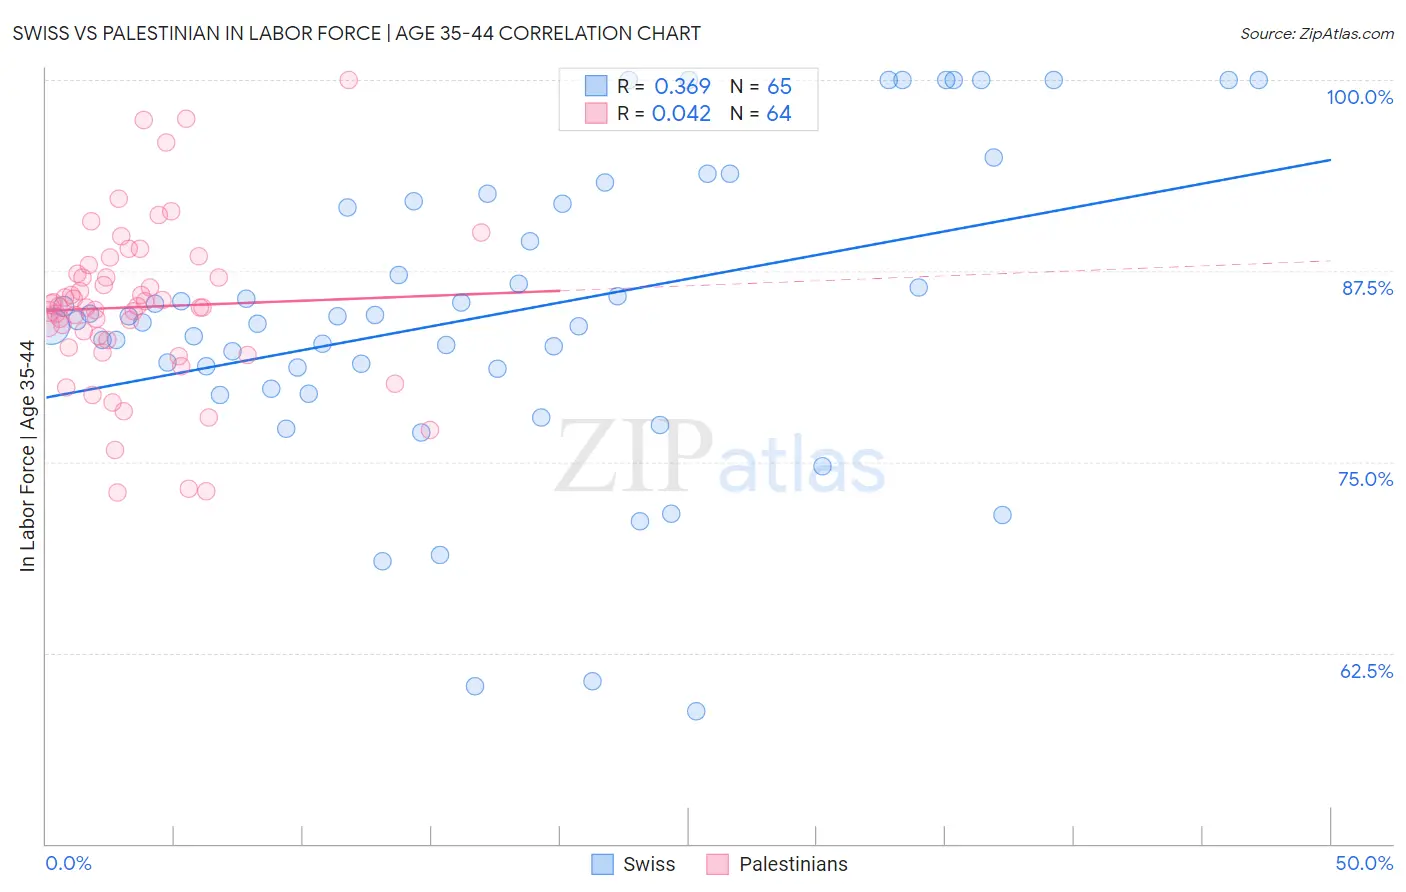
Swiss vs Palestinian In Labor Force | Age 35-44 Correlation Chart
The statistical analysis conducted on geographies consisting of 464,764,529 people shows a mild positive correlation between the proportion of Swiss and labor force participation rate among population between the ages 35 and 44 in the United States with a correlation coefficient (R) of 0.369 and weighted average of 84.2%. Similarly, the statistical analysis conducted on geographies consisting of 216,394,739 people shows no correlation between the proportion of Palestinians and labor force participation rate among population between the ages 35 and 44 in the United States with a correlation coefficient (R) of 0.042 and weighted average of 84.7%, a difference of 0.60%.
In Labor Force | Age 35-44 Correlation Summary
| Measurement | Swiss | Palestinian |
| Minimum | 58.7% | 73.0% |
| Maximum | 100.0% | 100.0% |
| Range | 41.3% | 27.0% |
| Mean | 84.7% | 85.1% |
| Median | 84.3% | 85.2% |
| Interquartile 25% (IQ1) | 80.4% | 82.7% |
| Interquartile 75% (IQ3) | 92.0% | 87.2% |
| Interquartile Range (IQR) | 11.6% | 4.5% |
| Standard Deviation (Sample) | 9.9% | 5.4% |
| Standard Deviation (Population) | 9.9% | 5.3% |
Similar Demographics by In Labor Force | Age 35-44
Demographics Similar to Swiss by In Labor Force | Age 35-44
In terms of in labor force | age 35-44, the demographic groups most similar to Swiss are Immigrants from North America (84.2%, a difference of 0.010%), New Zealander (84.1%, a difference of 0.010%), Immigrants from Canada (84.2%, a difference of 0.020%), Immigrants from Costa Rica (84.2%, a difference of 0.020%), and Laotian (84.2%, a difference of 0.020%).
| Demographics | Rating | Rank | In Labor Force | Age 35-44 |
| Immigrants | Uzbekistan | 22.8 /100 | #202 | Fair 84.2% |
| Immigrants | South Eastern Asia | 22.4 /100 | #203 | Fair 84.2% |
| Canadians | 19.9 /100 | #204 | Poor 84.2% |
| Immigrants | Canada | 19.6 /100 | #205 | Poor 84.2% |
| Immigrants | Costa Rica | 19.5 /100 | #206 | Poor 84.2% |
| Laotians | 19.0 /100 | #207 | Poor 84.2% |
| Immigrants | North America | 18.1 /100 | #208 | Poor 84.2% |
| Swiss | 17.4 /100 | #209 | Poor 84.2% |
| New Zealanders | 16.2 /100 | #210 | Poor 84.1% |
| Immigrants | Ecuador | 15.2 /100 | #211 | Poor 84.1% |
| Israelis | 14.0 /100 | #212 | Poor 84.1% |
| Bangladeshis | 13.7 /100 | #213 | Poor 84.1% |
| Immigrants | Barbados | 13.2 /100 | #214 | Poor 84.1% |
| Europeans | 12.2 /100 | #215 | Poor 84.1% |
| Nicaraguans | 12.1 /100 | #216 | Poor 84.1% |
Demographics Similar to Palestinians by In Labor Force | Age 35-44
In terms of in labor force | age 35-44, the demographic groups most similar to Palestinians are Bhutanese (84.7%, a difference of 0.0%), Immigrants from Scotland (84.7%, a difference of 0.0%), Austrian (84.7%, a difference of 0.0%), Immigrants from Ghana (84.7%, a difference of 0.010%), and German (84.7%, a difference of 0.020%).
| Demographics | Rating | Rank | In Labor Force | Age 35-44 |
| Germans | 91.0 /100 | #122 | Exceptional 84.7% |
| Immigrants | South America | 90.9 /100 | #123 | Exceptional 84.7% |
| Slavs | 90.8 /100 | #124 | Exceptional 84.7% |
| Maltese | 90.8 /100 | #125 | Exceptional 84.7% |
| Asians | 90.6 /100 | #126 | Exceptional 84.7% |
| Immigrants | Spain | 90.6 /100 | #127 | Exceptional 84.7% |
| Immigrants | Ghana | 90.4 /100 | #128 | Exceptional 84.7% |
| Palestinians | 89.7 /100 | #129 | Excellent 84.7% |
| Bhutanese | 89.7 /100 | #130 | Excellent 84.7% |
| Immigrants | Scotland | 89.6 /100 | #131 | Excellent 84.7% |
| Austrians | 89.4 /100 | #132 | Excellent 84.7% |
| Argentineans | 88.4 /100 | #133 | Excellent 84.6% |
| Immigrants | Korea | 88.2 /100 | #134 | Excellent 84.6% |
| Immigrants | Malaysia | 87.5 /100 | #135 | Excellent 84.6% |
| Afghans | 86.3 /100 | #136 | Excellent 84.6% |