Somali vs Samoan In Labor Force | Age 20-24
COMPARE
Somali
Samoan
In Labor Force | Age 20-24
In Labor Force | Age 20-24 Comparison
Somalis
Samoans
79.3%
IN LABOR FORCE | AGE 20-24
100.0/ 100
METRIC RATING
3rd/ 347
METRIC RANK
77.4%
IN LABOR FORCE | AGE 20-24
100.0/ 100
METRIC RATING
46th/ 347
METRIC RANK
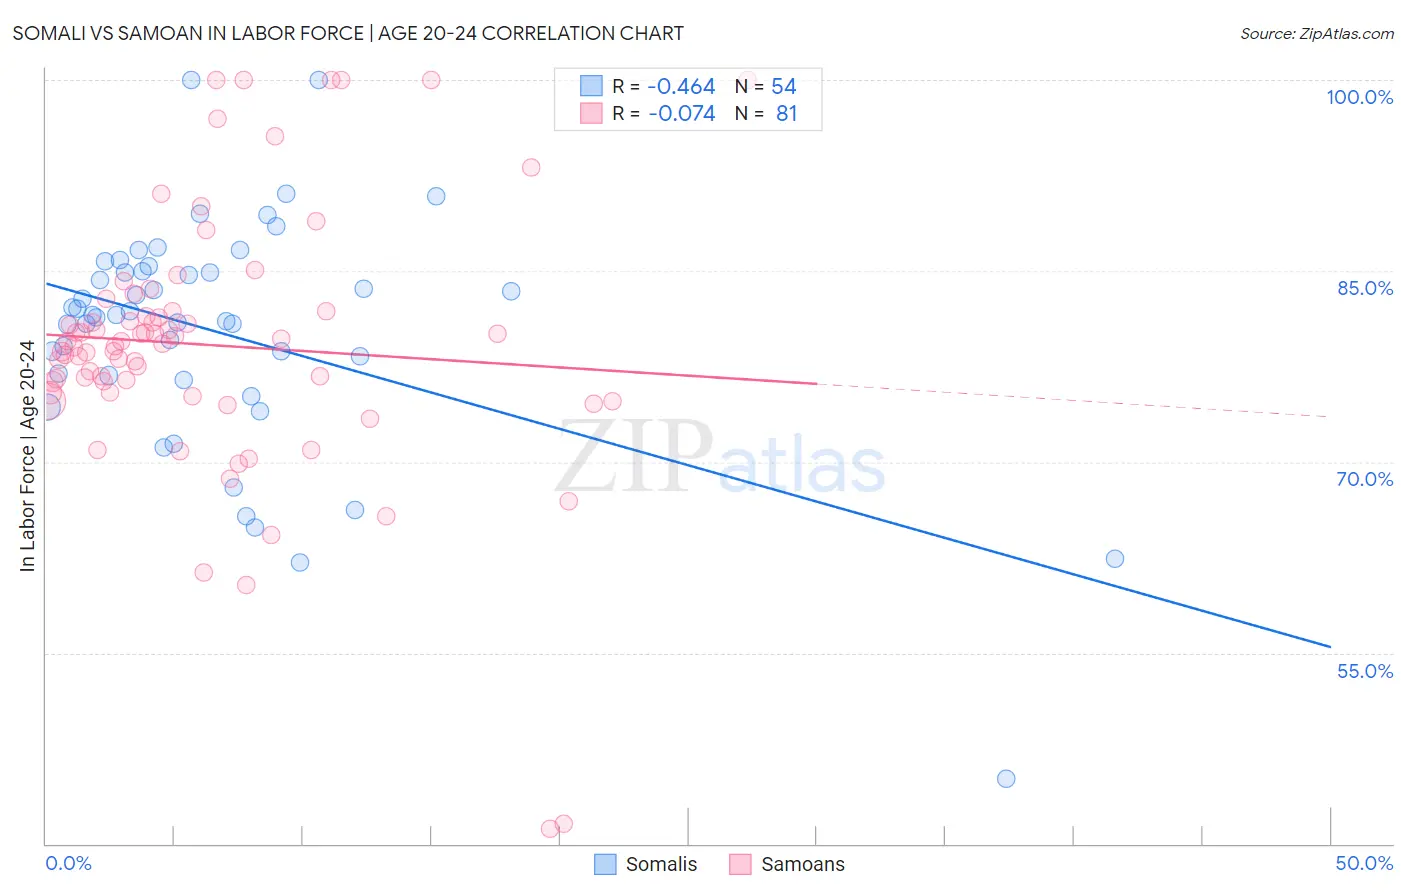
Somali vs Samoan In Labor Force | Age 20-24 Correlation Chart
The statistical analysis conducted on geographies consisting of 99,329,661 people shows a moderate negative correlation between the proportion of Somalis and labor force participation rate among population between the ages 20 and 24 in the United States with a correlation coefficient (R) of -0.464 and weighted average of 79.3%. Similarly, the statistical analysis conducted on geographies consisting of 225,156,890 people shows a slight negative correlation between the proportion of Samoans and labor force participation rate among population between the ages 20 and 24 in the United States with a correlation coefficient (R) of -0.074 and weighted average of 77.4%, a difference of 2.5%.
In Labor Force | Age 20-24 Correlation Summary
| Measurement | Somali | Samoan |
| Minimum | 45.1% | 41.2% |
| Maximum | 100.0% | 100.0% |
| Range | 54.9% | 58.8% |
| Mean | 80.1% | 79.2% |
| Median | 81.5% | 79.2% |
| Interquartile 25% (IQ1) | 76.8% | 75.5% |
| Interquartile 75% (IQ3) | 84.9% | 81.8% |
| Interquartile Range (IQR) | 8.2% | 6.3% |
| Standard Deviation (Sample) | 9.3% | 10.5% |
| Standard Deviation (Population) | 9.2% | 10.4% |
Similar Demographics by In Labor Force | Age 20-24
Demographics Similar to Somalis by In Labor Force | Age 20-24
In terms of in labor force | age 20-24, the demographic groups most similar to Somalis are Alaskan Athabascan (79.1%, a difference of 0.19%), Aleut (79.0%, a difference of 0.33%), Danish (79.0%, a difference of 0.34%), Immigrants from Somalia (79.5%, a difference of 0.36%), and Luxembourger (79.0%, a difference of 0.39%).
| Demographics | Rating | Rank | In Labor Force | Age 20-24 |
| Norwegians | 100.0 /100 | #1 | Exceptional 80.1% |
| Immigrants | Somalia | 100.0 /100 | #2 | Exceptional 79.5% |
| Somalis | 100.0 /100 | #3 | Exceptional 79.3% |
| Alaskan Athabascans | 100.0 /100 | #4 | Exceptional 79.1% |
| Aleuts | 100.0 /100 | #5 | Exceptional 79.0% |
| Danes | 100.0 /100 | #6 | Exceptional 79.0% |
| Luxembourgers | 100.0 /100 | #7 | Exceptional 79.0% |
| Immigrants | Cabo Verde | 100.0 /100 | #8 | Exceptional 78.9% |
| Swedes | 100.0 /100 | #9 | Exceptional 78.8% |
| Slovenes | 100.0 /100 | #10 | Exceptional 78.7% |
| Finns | 100.0 /100 | #11 | Exceptional 78.7% |
| Germans | 100.0 /100 | #12 | Exceptional 78.6% |
| Scandinavians | 100.0 /100 | #13 | Exceptional 78.5% |
| Czechs | 100.0 /100 | #14 | Exceptional 78.5% |
| Sudanese | 100.0 /100 | #15 | Exceptional 78.4% |
Demographics Similar to Samoans by In Labor Force | Age 20-24
In terms of in labor force | age 20-24, the demographic groups most similar to Samoans are Fijian (77.4%, a difference of 0.010%), Native Hawaiian (77.4%, a difference of 0.010%), French (77.4%, a difference of 0.030%), Immigrants from Laos (77.4%, a difference of 0.030%), and Immigrants from Congo (77.4%, a difference of 0.050%).
| Demographics | Rating | Rank | In Labor Force | Age 20-24 |
| Irish | 100.0 /100 | #39 | Exceptional 77.4% |
| Scottish | 100.0 /100 | #40 | Exceptional 77.4% |
| Immigrants | Congo | 100.0 /100 | #41 | Exceptional 77.4% |
| French | 100.0 /100 | #42 | Exceptional 77.4% |
| Immigrants | Laos | 100.0 /100 | #43 | Exceptional 77.4% |
| Fijians | 100.0 /100 | #44 | Exceptional 77.4% |
| Native Hawaiians | 100.0 /100 | #45 | Exceptional 77.4% |
| Samoans | 100.0 /100 | #46 | Exceptional 77.4% |
| Ethiopians | 100.0 /100 | #47 | Exceptional 77.3% |
| Serbians | 100.0 /100 | #48 | Exceptional 77.3% |
| Chinese | 100.0 /100 | #49 | Exceptional 77.3% |
| Malaysians | 100.0 /100 | #50 | Exceptional 77.2% |
| Croatians | 100.0 /100 | #51 | Exceptional 77.2% |
| Indonesians | 100.0 /100 | #52 | Exceptional 77.2% |
| Immigrants | Azores | 100.0 /100 | #53 | Exceptional 77.2% |