Tongan vs Samoan In Labor Force | Age 20-24
COMPARE
Tongan
Samoan
In Labor Force | Age 20-24
In Labor Force | Age 20-24 Comparison
Tongans
Samoans
77.9%
IN LABOR FORCE | AGE 20-24
100.0/ 100
METRIC RATING
26th/ 347
METRIC RANK
77.4%
IN LABOR FORCE | AGE 20-24
100.0/ 100
METRIC RATING
46th/ 347
METRIC RANK
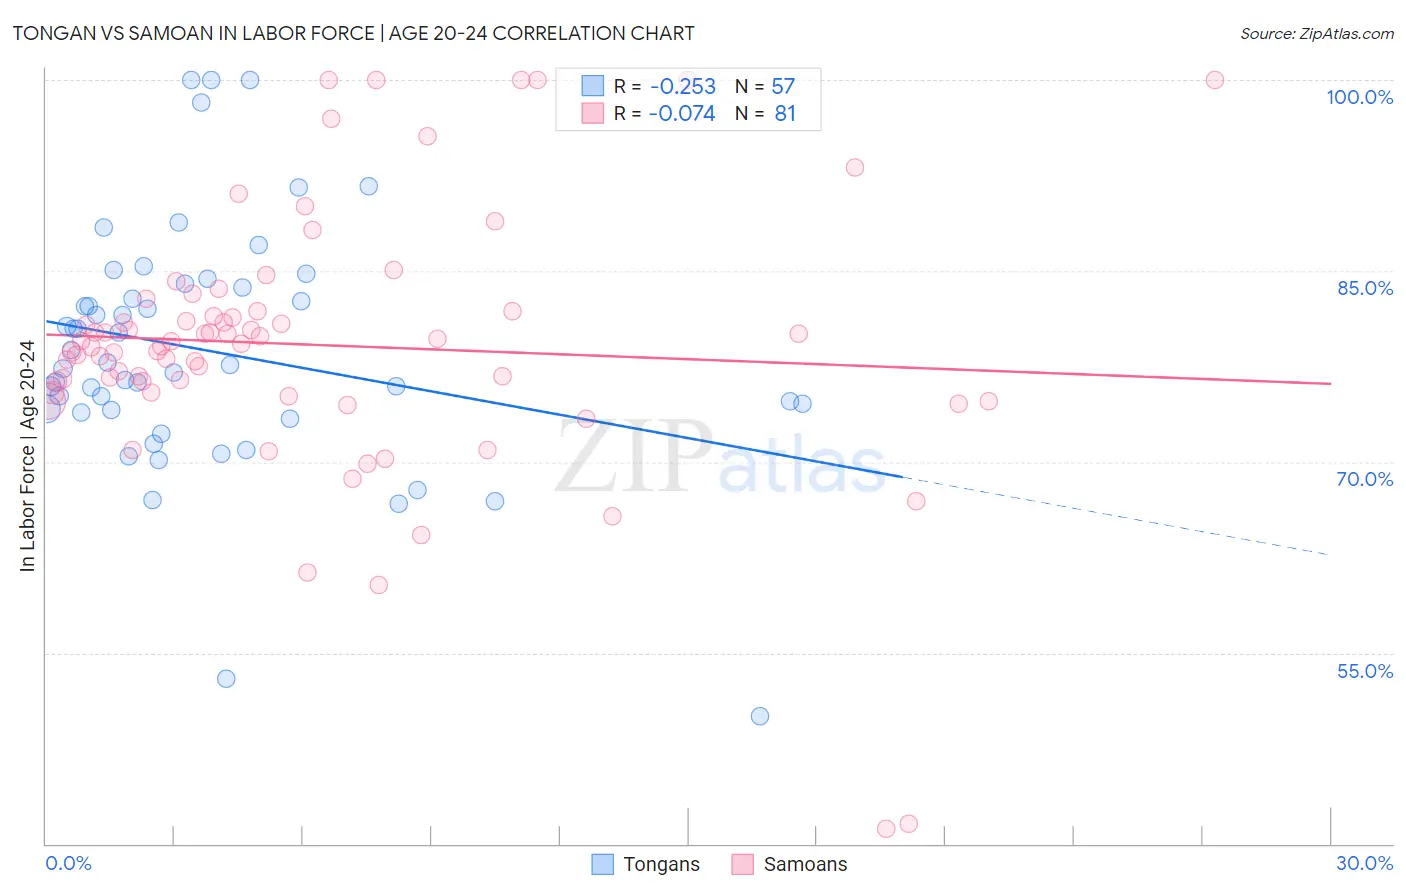
Tongan vs Samoan In Labor Force | Age 20-24 Correlation Chart
The statistical analysis conducted on geographies consisting of 102,904,168 people shows a weak negative correlation between the proportion of Tongans and labor force participation rate among population between the ages 20 and 24 in the United States with a correlation coefficient (R) of -0.253 and weighted average of 77.9%. Similarly, the statistical analysis conducted on geographies consisting of 225,156,890 people shows a slight negative correlation between the proportion of Samoans and labor force participation rate among population between the ages 20 and 24 in the United States with a correlation coefficient (R) of -0.074 and weighted average of 77.4%, a difference of 0.72%.
In Labor Force | Age 20-24 Correlation Summary
| Measurement | Tongan | Samoan |
| Minimum | 50.0% | 41.2% |
| Maximum | 100.0% | 100.0% |
| Range | 50.0% | 58.8% |
| Mean | 78.7% | 79.2% |
| Median | 77.6% | 79.2% |
| Interquartile 25% (IQ1) | 74.0% | 75.5% |
| Interquartile 75% (IQ3) | 83.8% | 81.8% |
| Interquartile Range (IQR) | 9.8% | 6.3% |
| Standard Deviation (Sample) | 9.7% | 10.5% |
| Standard Deviation (Population) | 9.6% | 10.4% |
Demographics Similar to Tongans and Samoans by In Labor Force | Age 20-24
In terms of in labor force | age 20-24, the demographic groups most similar to Tongans are Immigrants from Micronesia (77.8%, a difference of 0.12%), Belgian (77.8%, a difference of 0.16%), Slovak (77.7%, a difference of 0.25%), Swiss (77.7%, a difference of 0.26%), and Polish (77.6%, a difference of 0.38%). Similarly, the demographic groups most similar to Samoans are Fijian (77.4%, a difference of 0.010%), Native Hawaiian (77.4%, a difference of 0.010%), French (77.4%, a difference of 0.030%), Immigrants from Laos (77.4%, a difference of 0.030%), and Immigrants from Congo (77.4%, a difference of 0.050%).
| Demographics | Rating | Rank | In Labor Force | Age 20-24 |
| Tongans | 100.0 /100 | #26 | Exceptional 77.9% |
| Immigrants | Micronesia | 100.0 /100 | #27 | Exceptional 77.8% |
| Belgians | 100.0 /100 | #28 | Exceptional 77.8% |
| Slovaks | 100.0 /100 | #29 | Exceptional 77.7% |
| Swiss | 100.0 /100 | #30 | Exceptional 77.7% |
| Poles | 100.0 /100 | #31 | Exceptional 77.6% |
| English | 100.0 /100 | #32 | Exceptional 77.6% |
| Immigrants | Ethiopia | 100.0 /100 | #33 | Exceptional 77.5% |
| German Russians | 100.0 /100 | #34 | Exceptional 77.5% |
| Immigrants | Eastern Africa | 100.0 /100 | #35 | Exceptional 77.5% |
| Welsh | 100.0 /100 | #36 | Exceptional 77.5% |
| Czechoslovakians | 100.0 /100 | #37 | Exceptional 77.5% |
| Marshallese | 100.0 /100 | #38 | Exceptional 77.4% |
| Irish | 100.0 /100 | #39 | Exceptional 77.4% |
| Scottish | 100.0 /100 | #40 | Exceptional 77.4% |
| Immigrants | Congo | 100.0 /100 | #41 | Exceptional 77.4% |
| French | 100.0 /100 | #42 | Exceptional 77.4% |
| Immigrants | Laos | 100.0 /100 | #43 | Exceptional 77.4% |
| Fijians | 100.0 /100 | #44 | Exceptional 77.4% |
| Native Hawaiians | 100.0 /100 | #45 | Exceptional 77.4% |
| Samoans | 100.0 /100 | #46 | Exceptional 77.4% |