Somali vs South American In Labor Force | Age 20-24
COMPARE
Somali
South American
In Labor Force | Age 20-24
In Labor Force | Age 20-24 Comparison
Somalis
South Americans
79.3%
IN LABOR FORCE | AGE 20-24
100.0/ 100
METRIC RATING
3rd/ 347
METRIC RANK
73.5%
IN LABOR FORCE | AGE 20-24
0.4/ 100
METRIC RATING
268th/ 347
METRIC RANK
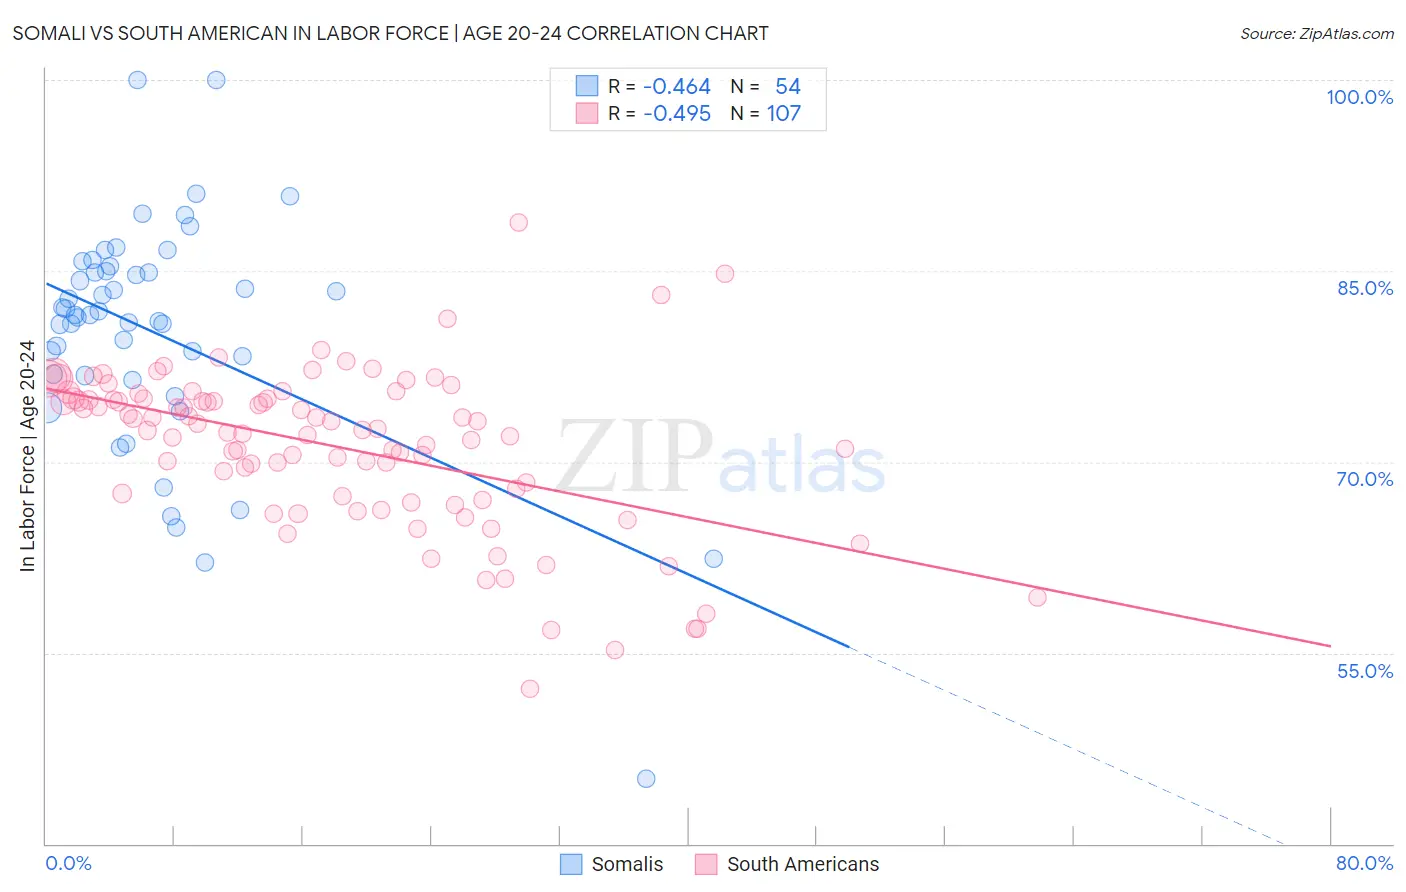
Somali vs South American In Labor Force | Age 20-24 Correlation Chart
The statistical analysis conducted on geographies consisting of 99,329,661 people shows a moderate negative correlation between the proportion of Somalis and labor force participation rate among population between the ages 20 and 24 in the United States with a correlation coefficient (R) of -0.464 and weighted average of 79.3%. Similarly, the statistical analysis conducted on geographies consisting of 493,868,145 people shows a moderate negative correlation between the proportion of South Americans and labor force participation rate among population between the ages 20 and 24 in the United States with a correlation coefficient (R) of -0.495 and weighted average of 73.5%, a difference of 7.8%.
In Labor Force | Age 20-24 Correlation Summary
| Measurement | Somali | South American |
| Minimum | 45.1% | 52.2% |
| Maximum | 100.0% | 88.8% |
| Range | 54.9% | 36.6% |
| Mean | 80.1% | 71.2% |
| Median | 81.5% | 72.5% |
| Interquartile 25% (IQ1) | 76.8% | 67.3% |
| Interquartile 75% (IQ3) | 84.9% | 75.0% |
| Interquartile Range (IQR) | 8.2% | 7.7% |
| Standard Deviation (Sample) | 9.3% | 6.3% |
| Standard Deviation (Population) | 9.2% | 6.3% |
Similar Demographics by In Labor Force | Age 20-24
Demographics Similar to Somalis by In Labor Force | Age 20-24
In terms of in labor force | age 20-24, the demographic groups most similar to Somalis are Alaskan Athabascan (79.1%, a difference of 0.19%), Aleut (79.0%, a difference of 0.33%), Danish (79.0%, a difference of 0.34%), Immigrants from Somalia (79.5%, a difference of 0.36%), and Luxembourger (79.0%, a difference of 0.39%).
| Demographics | Rating | Rank | In Labor Force | Age 20-24 |
| Norwegians | 100.0 /100 | #1 | Exceptional 80.1% |
| Immigrants | Somalia | 100.0 /100 | #2 | Exceptional 79.5% |
| Somalis | 100.0 /100 | #3 | Exceptional 79.3% |
| Alaskan Athabascans | 100.0 /100 | #4 | Exceptional 79.1% |
| Aleuts | 100.0 /100 | #5 | Exceptional 79.0% |
| Danes | 100.0 /100 | #6 | Exceptional 79.0% |
| Luxembourgers | 100.0 /100 | #7 | Exceptional 79.0% |
| Immigrants | Cabo Verde | 100.0 /100 | #8 | Exceptional 78.9% |
| Swedes | 100.0 /100 | #9 | Exceptional 78.8% |
| Slovenes | 100.0 /100 | #10 | Exceptional 78.7% |
| Finns | 100.0 /100 | #11 | Exceptional 78.7% |
| Germans | 100.0 /100 | #12 | Exceptional 78.6% |
| Scandinavians | 100.0 /100 | #13 | Exceptional 78.5% |
| Czechs | 100.0 /100 | #14 | Exceptional 78.5% |
| Sudanese | 100.0 /100 | #15 | Exceptional 78.4% |
Demographics Similar to South Americans by In Labor Force | Age 20-24
In terms of in labor force | age 20-24, the demographic groups most similar to South Americans are Colombian (73.5%, a difference of 0.030%), Immigrants from Western Asia (73.5%, a difference of 0.050%), Immigrants from Russia (73.5%, a difference of 0.060%), Burmese (73.6%, a difference of 0.090%), and Haitian (73.6%, a difference of 0.090%).
| Demographics | Rating | Rank | In Labor Force | Age 20-24 |
| Houma | 0.6 /100 | #261 | Tragic 73.7% |
| Asians | 0.6 /100 | #262 | Tragic 73.7% |
| Immigrants | Asia | 0.5 /100 | #263 | Tragic 73.6% |
| Immigrants | Haiti | 0.5 /100 | #264 | Tragic 73.6% |
| Burmese | 0.5 /100 | #265 | Tragic 73.6% |
| Haitians | 0.5 /100 | #266 | Tragic 73.6% |
| Immigrants | Western Asia | 0.4 /100 | #267 | Tragic 73.5% |
| South Americans | 0.4 /100 | #268 | Tragic 73.5% |
| Colombians | 0.3 /100 | #269 | Tragic 73.5% |
| Immigrants | Russia | 0.3 /100 | #270 | Tragic 73.5% |
| Immigrants | Indonesia | 0.3 /100 | #271 | Tragic 73.4% |
| Belizeans | 0.3 /100 | #272 | Tragic 73.4% |
| Cheyenne | 0.2 /100 | #273 | Tragic 73.4% |
| Immigrants | Colombia | 0.2 /100 | #274 | Tragic 73.4% |
| Immigrants | South America | 0.2 /100 | #275 | Tragic 73.3% |