Cambodian vs Samoan In Labor Force | Age 20-24
COMPARE
Cambodian
Samoan
In Labor Force | Age 20-24
In Labor Force | Age 20-24 Comparison
Cambodians
Samoans
75.2%
IN LABOR FORCE | AGE 20-24
60.5/ 100
METRIC RATING
166th/ 347
METRIC RANK
77.4%
IN LABOR FORCE | AGE 20-24
100.0/ 100
METRIC RATING
46th/ 347
METRIC RANK
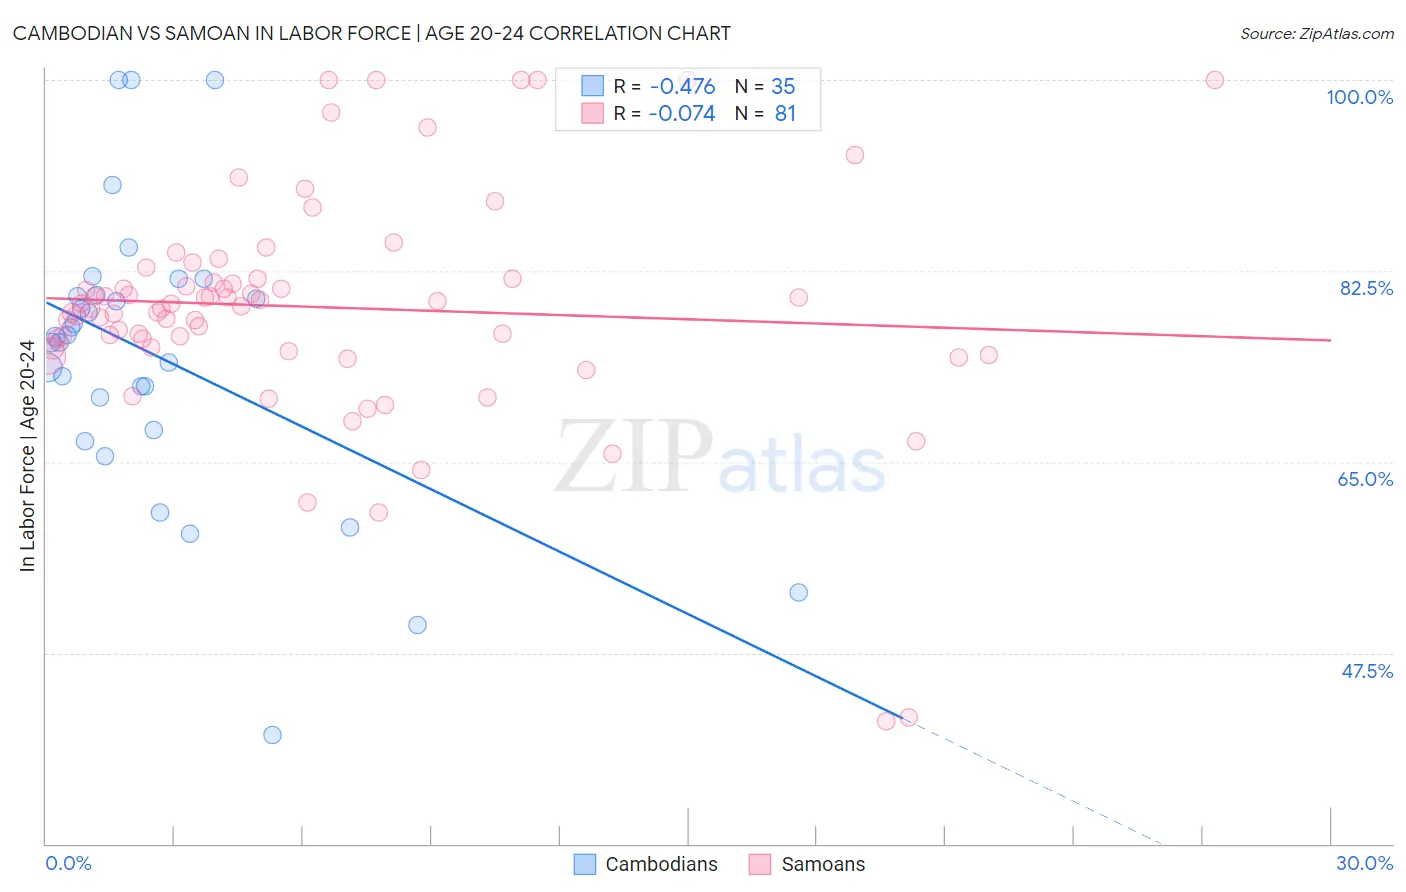
Cambodian vs Samoan In Labor Force | Age 20-24 Correlation Chart
The statistical analysis conducted on geographies consisting of 102,513,868 people shows a moderate negative correlation between the proportion of Cambodians and labor force participation rate among population between the ages 20 and 24 in the United States with a correlation coefficient (R) of -0.476 and weighted average of 75.2%. Similarly, the statistical analysis conducted on geographies consisting of 225,156,890 people shows a slight negative correlation between the proportion of Samoans and labor force participation rate among population between the ages 20 and 24 in the United States with a correlation coefficient (R) of -0.074 and weighted average of 77.4%, a difference of 2.9%.
In Labor Force | Age 20-24 Correlation Summary
| Measurement | Cambodian | Samoan |
| Minimum | 40.0% | 41.2% |
| Maximum | 100.0% | 100.0% |
| Range | 60.0% | 58.8% |
| Mean | 74.7% | 79.2% |
| Median | 76.5% | 79.2% |
| Interquartile 25% (IQ1) | 68.0% | 75.5% |
| Interquartile 75% (IQ3) | 80.3% | 81.8% |
| Interquartile Range (IQR) | 12.4% | 6.3% |
| Standard Deviation (Sample) | 13.1% | 10.5% |
| Standard Deviation (Population) | 12.9% | 10.4% |
Similar Demographics by In Labor Force | Age 20-24
Demographics Similar to Cambodians by In Labor Force | Age 20-24
In terms of in labor force | age 20-24, the demographic groups most similar to Cambodians are Immigrants from South Eastern Asia (75.1%, a difference of 0.040%), Bolivian (75.2%, a difference of 0.050%), Afghan (75.2%, a difference of 0.050%), Immigrants from Romania (75.2%, a difference of 0.060%), and Costa Rican (75.2%, a difference of 0.060%).
| Demographics | Rating | Rank | In Labor Force | Age 20-24 |
| South American Indians | 69.0 /100 | #159 | Good 75.3% |
| Japanese | 68.7 /100 | #160 | Good 75.3% |
| New Zealanders | 65.4 /100 | #161 | Good 75.2% |
| Immigrants | Romania | 64.6 /100 | #162 | Good 75.2% |
| Costa Ricans | 64.2 /100 | #163 | Good 75.2% |
| Bolivians | 64.0 /100 | #164 | Good 75.2% |
| Afghans | 63.5 /100 | #165 | Good 75.2% |
| Cambodians | 60.5 /100 | #166 | Good 75.2% |
| Immigrants | South Eastern Asia | 57.5 /100 | #167 | Average 75.1% |
| Immigrants | Western Africa | 56.7 /100 | #168 | Average 75.1% |
| Immigrants | Philippines | 55.8 /100 | #169 | Average 75.1% |
| Mexicans | 52.1 /100 | #170 | Average 75.1% |
| Cajuns | 51.1 /100 | #171 | Average 75.1% |
| Yakama | 50.8 /100 | #172 | Average 75.1% |
| Immigrants | Croatia | 50.2 /100 | #173 | Average 75.1% |
Demographics Similar to Samoans by In Labor Force | Age 20-24
In terms of in labor force | age 20-24, the demographic groups most similar to Samoans are Fijian (77.4%, a difference of 0.010%), Native Hawaiian (77.4%, a difference of 0.010%), French (77.4%, a difference of 0.030%), Immigrants from Laos (77.4%, a difference of 0.030%), and Immigrants from Congo (77.4%, a difference of 0.050%).
| Demographics | Rating | Rank | In Labor Force | Age 20-24 |
| Irish | 100.0 /100 | #39 | Exceptional 77.4% |
| Scottish | 100.0 /100 | #40 | Exceptional 77.4% |
| Immigrants | Congo | 100.0 /100 | #41 | Exceptional 77.4% |
| French | 100.0 /100 | #42 | Exceptional 77.4% |
| Immigrants | Laos | 100.0 /100 | #43 | Exceptional 77.4% |
| Fijians | 100.0 /100 | #44 | Exceptional 77.4% |
| Native Hawaiians | 100.0 /100 | #45 | Exceptional 77.4% |
| Samoans | 100.0 /100 | #46 | Exceptional 77.4% |
| Ethiopians | 100.0 /100 | #47 | Exceptional 77.3% |
| Serbians | 100.0 /100 | #48 | Exceptional 77.3% |
| Chinese | 100.0 /100 | #49 | Exceptional 77.3% |
| Malaysians | 100.0 /100 | #50 | Exceptional 77.2% |
| Croatians | 100.0 /100 | #51 | Exceptional 77.2% |
| Indonesians | 100.0 /100 | #52 | Exceptional 77.2% |
| Immigrants | Azores | 100.0 /100 | #53 | Exceptional 77.2% |