Somali vs Shoshone In Labor Force | Age 20-24
COMPARE
Somali
Shoshone
In Labor Force | Age 20-24
In Labor Force | Age 20-24 Comparison
Somalis
Shoshone
79.3%
IN LABOR FORCE | AGE 20-24
100.0/ 100
METRIC RATING
3rd/ 347
METRIC RANK
76.1%
IN LABOR FORCE | AGE 20-24
97.8/ 100
METRIC RATING
100th/ 347
METRIC RANK
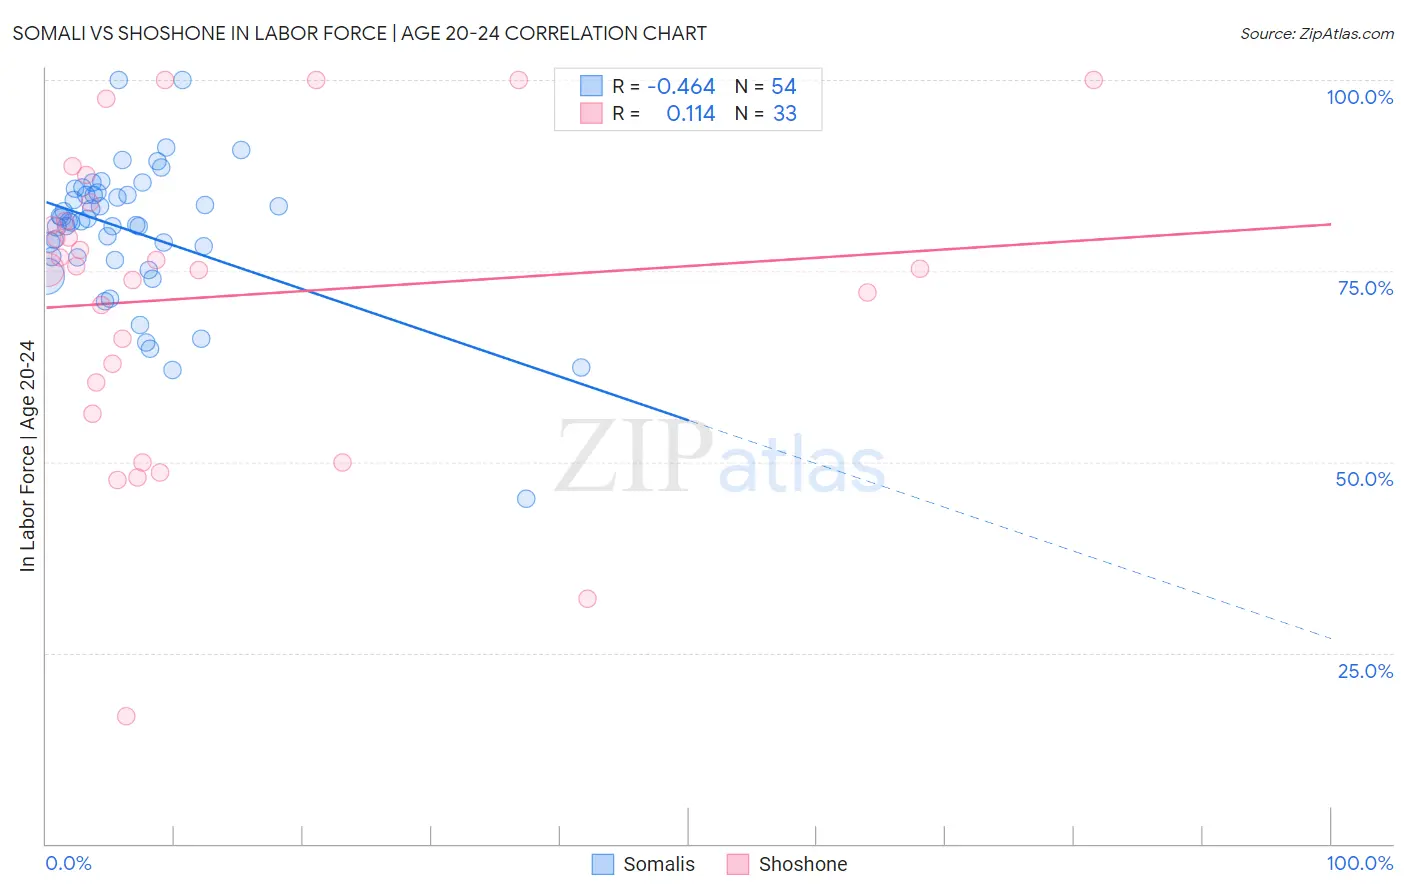
Somali vs Shoshone In Labor Force | Age 20-24 Correlation Chart
The statistical analysis conducted on geographies consisting of 99,329,661 people shows a moderate negative correlation between the proportion of Somalis and labor force participation rate among population between the ages 20 and 24 in the United States with a correlation coefficient (R) of -0.464 and weighted average of 79.3%. Similarly, the statistical analysis conducted on geographies consisting of 66,581,429 people shows a poor positive correlation between the proportion of Shoshone and labor force participation rate among population between the ages 20 and 24 in the United States with a correlation coefficient (R) of 0.114 and weighted average of 76.1%, a difference of 4.2%.
In Labor Force | Age 20-24 Correlation Summary
| Measurement | Somali | Shoshone |
| Minimum | 45.1% | 16.7% |
| Maximum | 100.0% | 100.0% |
| Range | 54.9% | 83.3% |
| Mean | 80.1% | 71.7% |
| Median | 81.5% | 75.4% |
| Interquartile 25% (IQ1) | 76.8% | 58.4% |
| Interquartile 75% (IQ3) | 84.9% | 82.8% |
| Interquartile Range (IQR) | 8.2% | 24.4% |
| Standard Deviation (Sample) | 9.3% | 19.9% |
| Standard Deviation (Population) | 9.2% | 19.6% |
Similar Demographics by In Labor Force | Age 20-24
Demographics Similar to Somalis by In Labor Force | Age 20-24
In terms of in labor force | age 20-24, the demographic groups most similar to Somalis are Alaskan Athabascan (79.1%, a difference of 0.19%), Aleut (79.0%, a difference of 0.33%), Danish (79.0%, a difference of 0.34%), Immigrants from Somalia (79.5%, a difference of 0.36%), and Luxembourger (79.0%, a difference of 0.39%).
| Demographics | Rating | Rank | In Labor Force | Age 20-24 |
| Norwegians | 100.0 /100 | #1 | Exceptional 80.1% |
| Immigrants | Somalia | 100.0 /100 | #2 | Exceptional 79.5% |
| Somalis | 100.0 /100 | #3 | Exceptional 79.3% |
| Alaskan Athabascans | 100.0 /100 | #4 | Exceptional 79.1% |
| Aleuts | 100.0 /100 | #5 | Exceptional 79.0% |
| Danes | 100.0 /100 | #6 | Exceptional 79.0% |
| Luxembourgers | 100.0 /100 | #7 | Exceptional 79.0% |
| Immigrants | Cabo Verde | 100.0 /100 | #8 | Exceptional 78.9% |
| Swedes | 100.0 /100 | #9 | Exceptional 78.8% |
| Slovenes | 100.0 /100 | #10 | Exceptional 78.7% |
| Finns | 100.0 /100 | #11 | Exceptional 78.7% |
| Germans | 100.0 /100 | #12 | Exceptional 78.6% |
| Scandinavians | 100.0 /100 | #13 | Exceptional 78.5% |
| Czechs | 100.0 /100 | #14 | Exceptional 78.5% |
| Sudanese | 100.0 /100 | #15 | Exceptional 78.4% |
Demographics Similar to Shoshone by In Labor Force | Age 20-24
In terms of in labor force | age 20-24, the demographic groups most similar to Shoshone are American (76.1%, a difference of 0.0%), Immigrants from Poland (76.1%, a difference of 0.020%), Latvian (76.1%, a difference of 0.020%), Immigrants from Lithuania (76.1%, a difference of 0.040%), and Immigrants from Oceania (76.1%, a difference of 0.040%).
| Demographics | Rating | Rank | In Labor Force | Age 20-24 |
| Hungarians | 98.9 /100 | #93 | Exceptional 76.3% |
| Potawatomi | 98.5 /100 | #94 | Exceptional 76.2% |
| Immigrants | Germany | 98.5 /100 | #95 | Exceptional 76.2% |
| Immigrants | Nonimmigrants | 98.5 /100 | #96 | Exceptional 76.2% |
| Immigrants | Lithuania | 98.0 /100 | #97 | Exceptional 76.1% |
| Immigrants | Oceania | 98.0 /100 | #98 | Exceptional 76.1% |
| Americans | 97.8 /100 | #99 | Exceptional 76.1% |
| Shoshone | 97.8 /100 | #100 | Exceptional 76.1% |
| Immigrants | Poland | 97.7 /100 | #101 | Exceptional 76.1% |
| Latvians | 97.6 /100 | #102 | Exceptional 76.1% |
| Immigrants | North Macedonia | 97.5 /100 | #103 | Exceptional 76.1% |
| Macedonians | 97.2 /100 | #104 | Exceptional 76.0% |
| Immigrants | Nepal | 97.2 /100 | #105 | Exceptional 76.0% |
| Immigrants | Uganda | 97.1 /100 | #106 | Exceptional 76.0% |
| Greeks | 96.9 /100 | #107 | Exceptional 76.0% |