Immigrants from Belize vs Samoan In Labor Force | Age 20-24
COMPARE
Immigrants from Belize
Samoan
In Labor Force | Age 20-24
In Labor Force | Age 20-24 Comparison
Immigrants from Belize
Samoans
72.8%
IN LABOR FORCE | AGE 20-24
0.0/ 100
METRIC RATING
293rd/ 347
METRIC RANK
77.4%
IN LABOR FORCE | AGE 20-24
100.0/ 100
METRIC RATING
46th/ 347
METRIC RANK
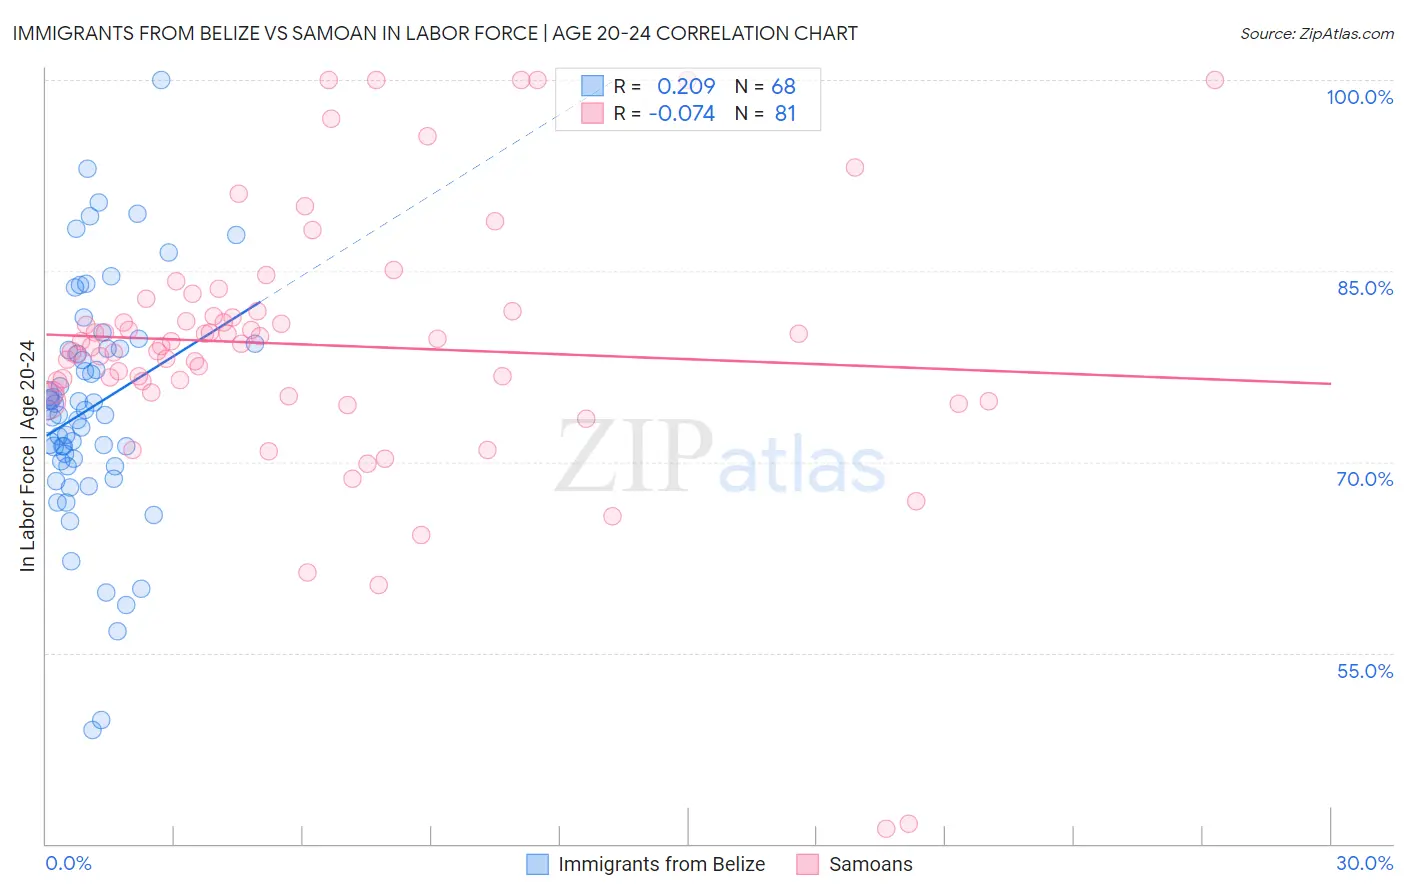
Immigrants from Belize vs Samoan In Labor Force | Age 20-24 Correlation Chart
The statistical analysis conducted on geographies consisting of 130,312,763 people shows a weak positive correlation between the proportion of Immigrants from Belize and labor force participation rate among population between the ages 20 and 24 in the United States with a correlation coefficient (R) of 0.209 and weighted average of 72.8%. Similarly, the statistical analysis conducted on geographies consisting of 225,156,890 people shows a slight negative correlation between the proportion of Samoans and labor force participation rate among population between the ages 20 and 24 in the United States with a correlation coefficient (R) of -0.074 and weighted average of 77.4%, a difference of 6.2%.
In Labor Force | Age 20-24 Correlation Summary
| Measurement | Immigrants from Belize | Samoan |
| Minimum | 49.0% | 41.2% |
| Maximum | 100.0% | 100.0% |
| Range | 51.0% | 58.8% |
| Mean | 74.2% | 79.2% |
| Median | 73.9% | 79.2% |
| Interquartile 25% (IQ1) | 69.9% | 75.5% |
| Interquartile 75% (IQ3) | 78.9% | 81.8% |
| Interquartile Range (IQR) | 9.0% | 6.3% |
| Standard Deviation (Sample) | 9.3% | 10.5% |
| Standard Deviation (Population) | 9.3% | 10.4% |
Similar Demographics by In Labor Force | Age 20-24
Demographics Similar to Immigrants from Belize by In Labor Force | Age 20-24
In terms of in labor force | age 20-24, the demographic groups most similar to Immigrants from Belize are Immigrants from Argentina (72.8%, a difference of 0.030%), Pueblo (72.9%, a difference of 0.060%), Okinawan (72.7%, a difference of 0.14%), Jamaican (72.7%, a difference of 0.14%), and Immigrants from Nicaragua (72.9%, a difference of 0.15%).
| Demographics | Rating | Rank | In Labor Force | Age 20-24 |
| Immigrants | Lebanon | 0.1 /100 | #286 | Tragic 73.1% |
| Immigrants | Korea | 0.1 /100 | #287 | Tragic 73.1% |
| Argentineans | 0.1 /100 | #288 | Tragic 73.1% |
| U.S. Virgin Islanders | 0.1 /100 | #289 | Tragic 73.0% |
| Immigrants | Belarus | 0.1 /100 | #290 | Tragic 73.0% |
| Immigrants | Nicaragua | 0.0 /100 | #291 | Tragic 72.9% |
| Pueblo | 0.0 /100 | #292 | Tragic 72.9% |
| Immigrants | Belize | 0.0 /100 | #293 | Tragic 72.8% |
| Immigrants | Argentina | 0.0 /100 | #294 | Tragic 72.8% |
| Okinawans | 0.0 /100 | #295 | Tragic 72.7% |
| Jamaicans | 0.0 /100 | #296 | Tragic 72.7% |
| Central American Indians | 0.0 /100 | #297 | Tragic 72.7% |
| Israelis | 0.0 /100 | #298 | Tragic 72.6% |
| Iranians | 0.0 /100 | #299 | Tragic 72.6% |
| Armenians | 0.0 /100 | #300 | Tragic 72.5% |
Demographics Similar to Samoans by In Labor Force | Age 20-24
In terms of in labor force | age 20-24, the demographic groups most similar to Samoans are Fijian (77.4%, a difference of 0.010%), Native Hawaiian (77.4%, a difference of 0.010%), French (77.4%, a difference of 0.030%), Immigrants from Laos (77.4%, a difference of 0.030%), and Immigrants from Congo (77.4%, a difference of 0.050%).
| Demographics | Rating | Rank | In Labor Force | Age 20-24 |
| Irish | 100.0 /100 | #39 | Exceptional 77.4% |
| Scottish | 100.0 /100 | #40 | Exceptional 77.4% |
| Immigrants | Congo | 100.0 /100 | #41 | Exceptional 77.4% |
| French | 100.0 /100 | #42 | Exceptional 77.4% |
| Immigrants | Laos | 100.0 /100 | #43 | Exceptional 77.4% |
| Fijians | 100.0 /100 | #44 | Exceptional 77.4% |
| Native Hawaiians | 100.0 /100 | #45 | Exceptional 77.4% |
| Samoans | 100.0 /100 | #46 | Exceptional 77.4% |
| Ethiopians | 100.0 /100 | #47 | Exceptional 77.3% |
| Serbians | 100.0 /100 | #48 | Exceptional 77.3% |
| Chinese | 100.0 /100 | #49 | Exceptional 77.3% |
| Malaysians | 100.0 /100 | #50 | Exceptional 77.2% |
| Croatians | 100.0 /100 | #51 | Exceptional 77.2% |
| Indonesians | 100.0 /100 | #52 | Exceptional 77.2% |
| Immigrants | Azores | 100.0 /100 | #53 | Exceptional 77.2% |