Somali vs Mongolian In Labor Force | Age 20-24
COMPARE
Somali
Mongolian
In Labor Force | Age 20-24
In Labor Force | Age 20-24 Comparison
Somalis
Mongolians
79.3%
IN LABOR FORCE | AGE 20-24
100.0/ 100
METRIC RATING
3rd/ 347
METRIC RANK
73.3%
IN LABOR FORCE | AGE 20-24
0.2/ 100
METRIC RATING
276th/ 347
METRIC RANK
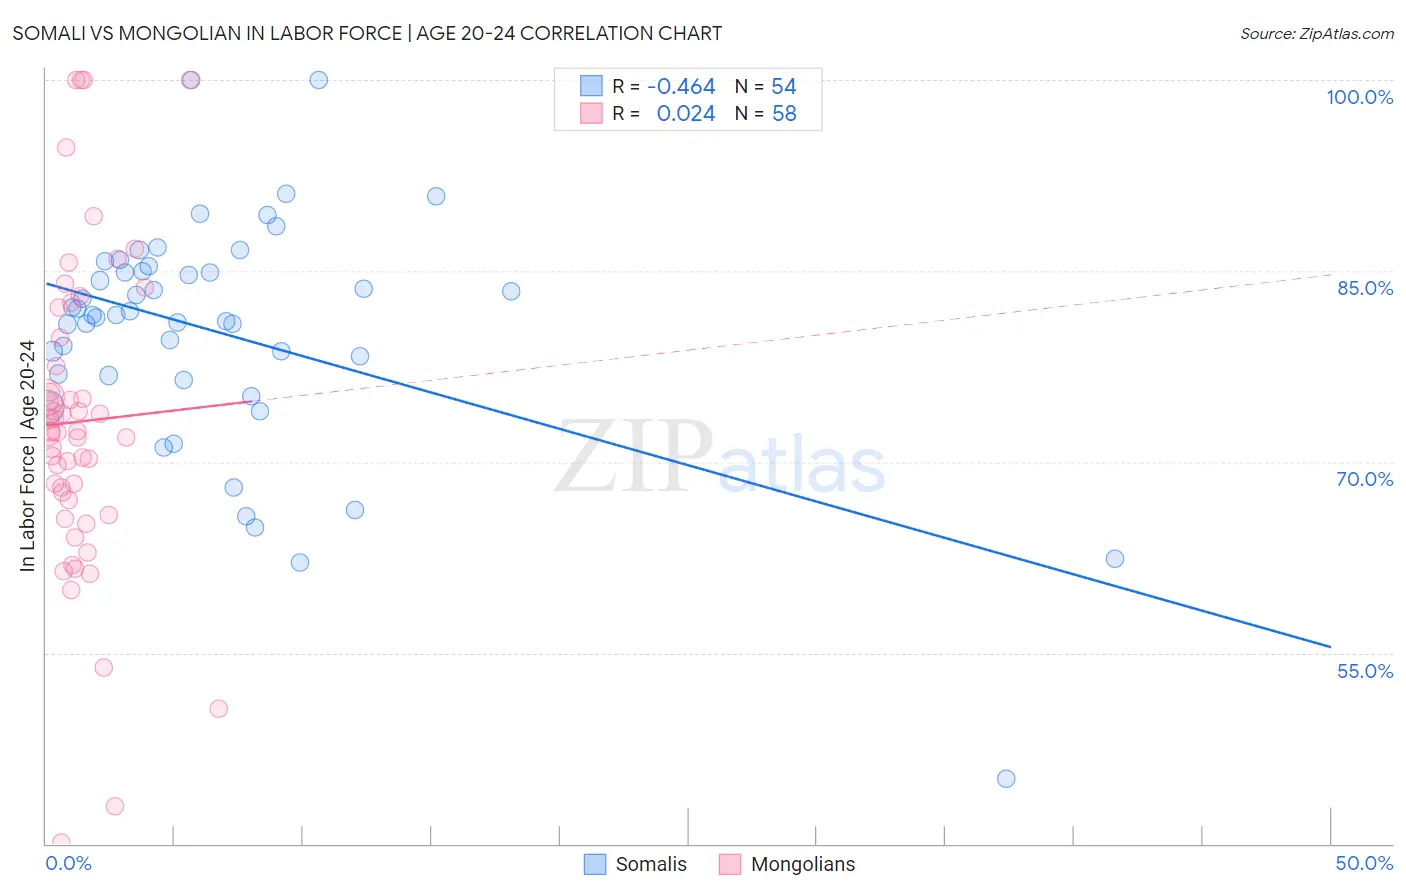
Somali vs Mongolian In Labor Force | Age 20-24 Correlation Chart
The statistical analysis conducted on geographies consisting of 99,329,661 people shows a moderate negative correlation between the proportion of Somalis and labor force participation rate among population between the ages 20 and 24 in the United States with a correlation coefficient (R) of -0.464 and weighted average of 79.3%. Similarly, the statistical analysis conducted on geographies consisting of 140,358,526 people shows no correlation between the proportion of Mongolians and labor force participation rate among population between the ages 20 and 24 in the United States with a correlation coefficient (R) of 0.024 and weighted average of 73.3%, a difference of 8.1%.
In Labor Force | Age 20-24 Correlation Summary
| Measurement | Somali | Mongolian |
| Minimum | 45.1% | 40.1% |
| Maximum | 100.0% | 100.0% |
| Range | 54.9% | 59.9% |
| Mean | 80.1% | 73.2% |
| Median | 81.5% | 72.4% |
| Interquartile 25% (IQ1) | 76.8% | 67.0% |
| Interquartile 75% (IQ3) | 84.9% | 79.7% |
| Interquartile Range (IQR) | 8.2% | 12.8% |
| Standard Deviation (Sample) | 9.3% | 12.5% |
| Standard Deviation (Population) | 9.2% | 12.4% |
Similar Demographics by In Labor Force | Age 20-24
Demographics Similar to Somalis by In Labor Force | Age 20-24
In terms of in labor force | age 20-24, the demographic groups most similar to Somalis are Alaskan Athabascan (79.1%, a difference of 0.19%), Aleut (79.0%, a difference of 0.33%), Danish (79.0%, a difference of 0.34%), Immigrants from Somalia (79.5%, a difference of 0.36%), and Luxembourger (79.0%, a difference of 0.39%).
| Demographics | Rating | Rank | In Labor Force | Age 20-24 |
| Norwegians | 100.0 /100 | #1 | Exceptional 80.1% |
| Immigrants | Somalia | 100.0 /100 | #2 | Exceptional 79.5% |
| Somalis | 100.0 /100 | #3 | Exceptional 79.3% |
| Alaskan Athabascans | 100.0 /100 | #4 | Exceptional 79.1% |
| Aleuts | 100.0 /100 | #5 | Exceptional 79.0% |
| Danes | 100.0 /100 | #6 | Exceptional 79.0% |
| Luxembourgers | 100.0 /100 | #7 | Exceptional 79.0% |
| Immigrants | Cabo Verde | 100.0 /100 | #8 | Exceptional 78.9% |
| Swedes | 100.0 /100 | #9 | Exceptional 78.8% |
| Slovenes | 100.0 /100 | #10 | Exceptional 78.7% |
| Finns | 100.0 /100 | #11 | Exceptional 78.7% |
| Germans | 100.0 /100 | #12 | Exceptional 78.6% |
| Scandinavians | 100.0 /100 | #13 | Exceptional 78.5% |
| Czechs | 100.0 /100 | #14 | Exceptional 78.5% |
| Sudanese | 100.0 /100 | #15 | Exceptional 78.4% |
Demographics Similar to Mongolians by In Labor Force | Age 20-24
In terms of in labor force | age 20-24, the demographic groups most similar to Mongolians are Immigrants from South America (73.3%, a difference of 0.010%), Immigrants from Malaysia (73.3%, a difference of 0.010%), Cypriot (73.3%, a difference of 0.030%), Venezuelan (73.3%, a difference of 0.030%), and Immigrants from Colombia (73.4%, a difference of 0.070%).
| Demographics | Rating | Rank | In Labor Force | Age 20-24 |
| Colombians | 0.3 /100 | #269 | Tragic 73.5% |
| Immigrants | Russia | 0.3 /100 | #270 | Tragic 73.5% |
| Immigrants | Indonesia | 0.3 /100 | #271 | Tragic 73.4% |
| Belizeans | 0.3 /100 | #272 | Tragic 73.4% |
| Cheyenne | 0.2 /100 | #273 | Tragic 73.4% |
| Immigrants | Colombia | 0.2 /100 | #274 | Tragic 73.4% |
| Immigrants | South America | 0.2 /100 | #275 | Tragic 73.3% |
| Mongolians | 0.2 /100 | #276 | Tragic 73.3% |
| Immigrants | Malaysia | 0.2 /100 | #277 | Tragic 73.3% |
| Cypriots | 0.2 /100 | #278 | Tragic 73.3% |
| Venezuelans | 0.2 /100 | #279 | Tragic 73.3% |
| Bahamians | 0.1 /100 | #280 | Tragic 73.3% |
| Immigrants | Venezuela | 0.1 /100 | #281 | Tragic 73.2% |
| Immigrants | Spain | 0.1 /100 | #282 | Tragic 73.2% |
| Immigrants | Bahamas | 0.1 /100 | #283 | Tragic 73.2% |