Somali vs Italian In Labor Force | Age 20-24
COMPARE
Somali
Italian
In Labor Force | Age 20-24
In Labor Force | Age 20-24 Comparison
Somalis
Italians
79.3%
IN LABOR FORCE | AGE 20-24
100.0/ 100
METRIC RATING
3rd/ 347
METRIC RANK
76.5%
IN LABOR FORCE | AGE 20-24
99.6/ 100
METRIC RATING
80th/ 347
METRIC RANK
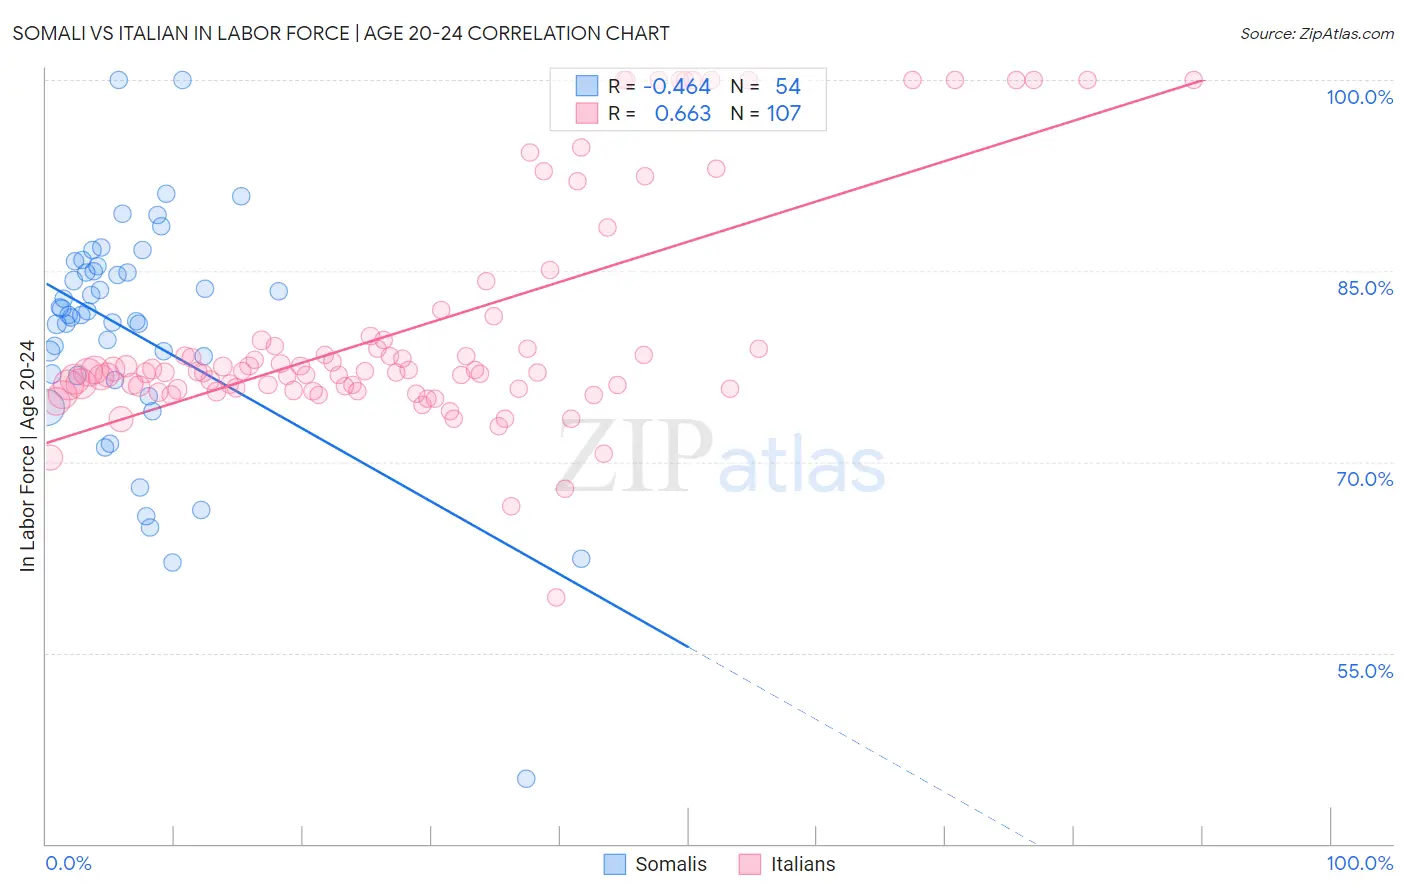
Somali vs Italian In Labor Force | Age 20-24 Correlation Chart
The statistical analysis conducted on geographies consisting of 99,329,661 people shows a moderate negative correlation between the proportion of Somalis and labor force participation rate among population between the ages 20 and 24 in the United States with a correlation coefficient (R) of -0.464 and weighted average of 79.3%. Similarly, the statistical analysis conducted on geographies consisting of 573,427,196 people shows a significant positive correlation between the proportion of Italians and labor force participation rate among population between the ages 20 and 24 in the United States with a correlation coefficient (R) of 0.663 and weighted average of 76.5%, a difference of 3.5%.
In Labor Force | Age 20-24 Correlation Summary
| Measurement | Somali | Italian |
| Minimum | 45.1% | 59.3% |
| Maximum | 100.0% | 100.0% |
| Range | 54.9% | 40.7% |
| Mean | 80.1% | 80.5% |
| Median | 81.5% | 77.1% |
| Interquartile 25% (IQ1) | 76.8% | 75.7% |
| Interquartile 75% (IQ3) | 84.9% | 79.6% |
| Interquartile Range (IQR) | 8.2% | 3.9% |
| Standard Deviation (Sample) | 9.3% | 9.1% |
| Standard Deviation (Population) | 9.2% | 9.0% |
Similar Demographics by In Labor Force | Age 20-24
Demographics Similar to Somalis by In Labor Force | Age 20-24
In terms of in labor force | age 20-24, the demographic groups most similar to Somalis are Alaskan Athabascan (79.1%, a difference of 0.19%), Aleut (79.0%, a difference of 0.33%), Danish (79.0%, a difference of 0.34%), Immigrants from Somalia (79.5%, a difference of 0.36%), and Luxembourger (79.0%, a difference of 0.39%).
| Demographics | Rating | Rank | In Labor Force | Age 20-24 |
| Norwegians | 100.0 /100 | #1 | Exceptional 80.1% |
| Immigrants | Somalia | 100.0 /100 | #2 | Exceptional 79.5% |
| Somalis | 100.0 /100 | #3 | Exceptional 79.3% |
| Alaskan Athabascans | 100.0 /100 | #4 | Exceptional 79.1% |
| Aleuts | 100.0 /100 | #5 | Exceptional 79.0% |
| Danes | 100.0 /100 | #6 | Exceptional 79.0% |
| Luxembourgers | 100.0 /100 | #7 | Exceptional 79.0% |
| Immigrants | Cabo Verde | 100.0 /100 | #8 | Exceptional 78.9% |
| Swedes | 100.0 /100 | #9 | Exceptional 78.8% |
| Slovenes | 100.0 /100 | #10 | Exceptional 78.7% |
| Finns | 100.0 /100 | #11 | Exceptional 78.7% |
| Germans | 100.0 /100 | #12 | Exceptional 78.6% |
| Scandinavians | 100.0 /100 | #13 | Exceptional 78.5% |
| Czechs | 100.0 /100 | #14 | Exceptional 78.5% |
| Sudanese | 100.0 /100 | #15 | Exceptional 78.4% |
Demographics Similar to Italians by In Labor Force | Age 20-24
In terms of in labor force | age 20-24, the demographic groups most similar to Italians are Basque (76.5%, a difference of 0.020%), Hmong (76.5%, a difference of 0.020%), Immigrants from Zaire (76.6%, a difference of 0.030%), Immigrants from Cameroon (76.6%, a difference of 0.050%), and Canadian (76.6%, a difference of 0.050%).
| Demographics | Rating | Rank | In Labor Force | Age 20-24 |
| British | 99.8 /100 | #73 | Exceptional 76.7% |
| Cree | 99.7 /100 | #74 | Exceptional 76.6% |
| Immigrants | Middle Africa | 99.7 /100 | #75 | Exceptional 76.6% |
| Immigrants | Moldova | 99.6 /100 | #76 | Exceptional 76.6% |
| Immigrants | Cameroon | 99.6 /100 | #77 | Exceptional 76.6% |
| Canadians | 99.6 /100 | #78 | Exceptional 76.6% |
| Immigrants | Zaire | 99.6 /100 | #79 | Exceptional 76.6% |
| Italians | 99.6 /100 | #80 | Exceptional 76.5% |
| Basques | 99.5 /100 | #81 | Exceptional 76.5% |
| Hmong | 99.5 /100 | #82 | Exceptional 76.5% |
| Carpatho Rusyns | 99.4 /100 | #83 | Exceptional 76.5% |
| Austrians | 99.4 /100 | #84 | Exceptional 76.5% |
| Portuguese | 99.3 /100 | #85 | Exceptional 76.4% |
| Immigrants | Iraq | 99.3 /100 | #86 | Exceptional 76.4% |
| Immigrants | Thailand | 99.3 /100 | #87 | Exceptional 76.4% |