Somali vs Guamanian/Chamorro In Labor Force | Age > 16
COMPARE
Somali
Guamanian/Chamorro
In Labor Force | Age > 16
In Labor Force | Age > 16 Comparison
Somalis
Guamanians/Chamorros
69.2%
IN LABOR FORCE | AGE > 16
100.0/ 100
METRIC RATING
3rd/ 347
METRIC RANK
65.6%
IN LABOR FORCE | AGE > 16
92.4/ 100
METRIC RATING
137th/ 347
METRIC RANK
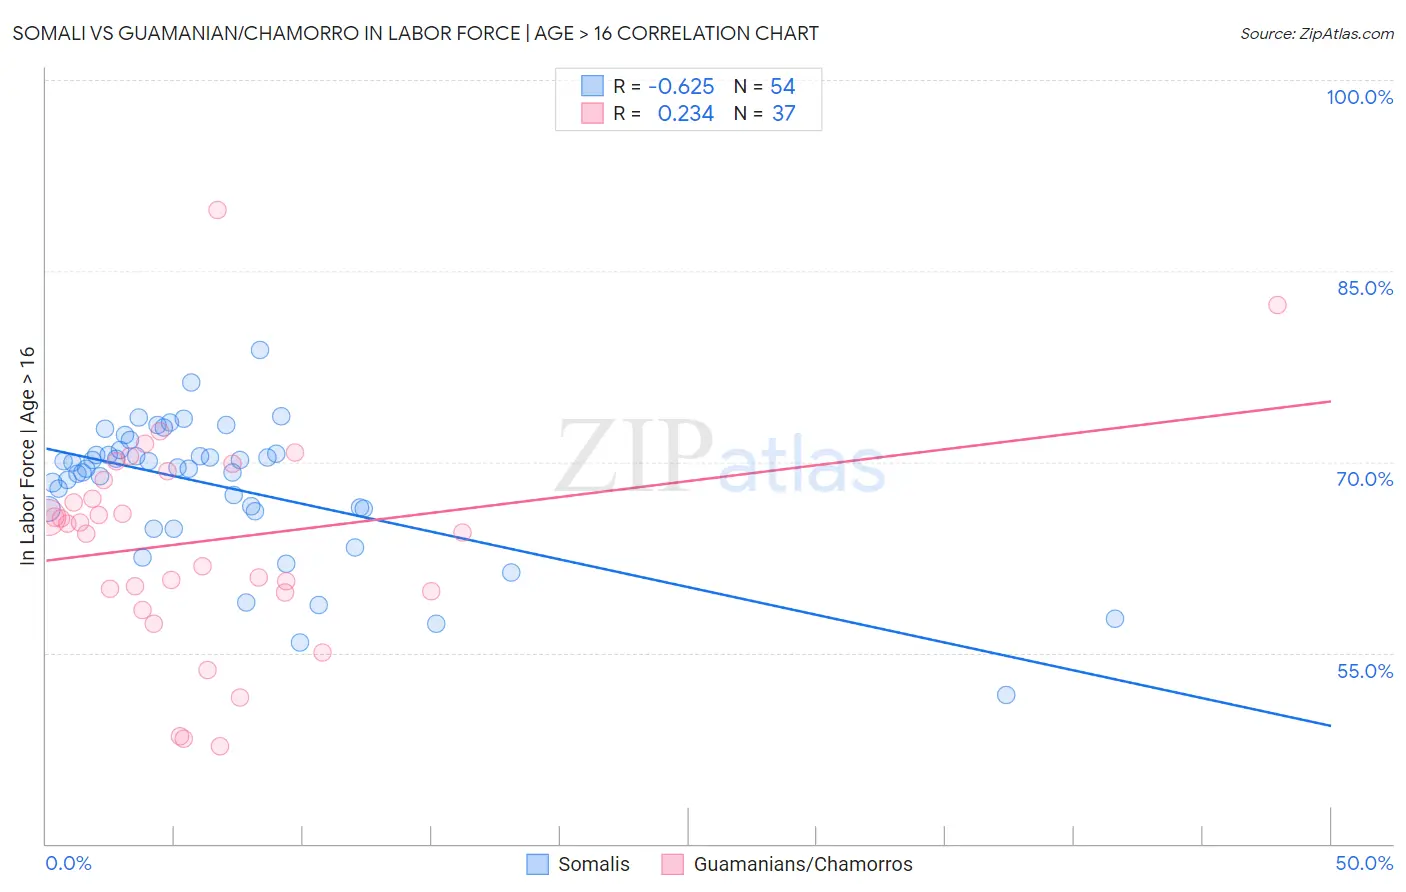
Somali vs Guamanian/Chamorro In Labor Force | Age > 16 Correlation Chart
The statistical analysis conducted on geographies consisting of 99,331,399 people shows a significant negative correlation between the proportion of Somalis and labor force participation rate among population ages 16 and over in the United States with a correlation coefficient (R) of -0.625 and weighted average of 69.2%. Similarly, the statistical analysis conducted on geographies consisting of 221,958,282 people shows a weak positive correlation between the proportion of Guamanians/Chamorros and labor force participation rate among population ages 16 and over in the United States with a correlation coefficient (R) of 0.234 and weighted average of 65.6%, a difference of 5.5%.
In Labor Force | Age > 16 Correlation Summary
| Measurement | Somali | Guamanian/Chamorro |
| Minimum | 51.7% | 47.6% |
| Maximum | 78.8% | 89.8% |
| Range | 27.1% | 42.2% |
| Mean | 68.1% | 63.8% |
| Median | 69.5% | 65.1% |
| Interquartile 25% (IQ1) | 66.3% | 59.8% |
| Interquartile 75% (IQ3) | 70.6% | 68.9% |
| Interquartile Range (IQR) | 4.3% | 9.2% |
| Standard Deviation (Sample) | 5.3% | 8.6% |
| Standard Deviation (Population) | 5.2% | 8.5% |
Similar Demographics by In Labor Force | Age > 16
Demographics Similar to Somalis by In Labor Force | Age > 16
In terms of in labor force | age > 16, the demographic groups most similar to Somalis are Immigrants from Somalia (69.1%, a difference of 0.070%), Ethiopian (69.3%, a difference of 0.20%), Immigrants from Ethiopia (69.4%, a difference of 0.36%), Sierra Leonean (68.9%, a difference of 0.38%), and Immigrants from Eritrea (68.9%, a difference of 0.43%).
| Demographics | Rating | Rank | In Labor Force | Age > 16 |
| Immigrants | Ethiopia | 100.0 /100 | #1 | Exceptional 69.4% |
| Ethiopians | 100.0 /100 | #2 | Exceptional 69.3% |
| Somalis | 100.0 /100 | #3 | Exceptional 69.2% |
| Immigrants | Somalia | 100.0 /100 | #4 | Exceptional 69.1% |
| Sierra Leoneans | 100.0 /100 | #5 | Exceptional 68.9% |
| Immigrants | Eritrea | 100.0 /100 | #6 | Exceptional 68.9% |
| Immigrants | Cameroon | 100.0 /100 | #7 | Exceptional 68.7% |
| Immigrants | Sierra Leone | 100.0 /100 | #8 | Exceptional 68.5% |
| Immigrants | Eastern Africa | 100.0 /100 | #9 | Exceptional 68.5% |
| Immigrants | Bolivia | 100.0 /100 | #10 | Exceptional 68.4% |
| Bolivians | 100.0 /100 | #11 | Exceptional 68.2% |
| Sudanese | 100.0 /100 | #12 | Exceptional 68.0% |
| Immigrants | Nepal | 100.0 /100 | #13 | Exceptional 68.0% |
| Liberians | 100.0 /100 | #14 | Exceptional 67.8% |
| Immigrants | Middle Africa | 100.0 /100 | #15 | Exceptional 67.7% |
Demographics Similar to Guamanians/Chamorros by In Labor Force | Age > 16
In terms of in labor force | age > 16, the demographic groups most similar to Guamanians/Chamorros are Guatemalan (65.6%, a difference of 0.0%), Immigrants from Argentina (65.6%, a difference of 0.0%), Immigrants from West Indies (65.6%, a difference of 0.010%), Costa Rican (65.6%, a difference of 0.040%), and Immigrants from Lithuania (65.6%, a difference of 0.050%).
| Demographics | Rating | Rank | In Labor Force | Age > 16 |
| Immigrants | Guatemala | 94.4 /100 | #130 | Exceptional 65.6% |
| Icelanders | 94.3 /100 | #131 | Exceptional 65.6% |
| Immigrants | North Macedonia | 94.1 /100 | #132 | Exceptional 65.6% |
| Immigrants | Lithuania | 93.5 /100 | #133 | Exceptional 65.6% |
| Costa Ricans | 93.2 /100 | #134 | Exceptional 65.6% |
| Guatemalans | 92.5 /100 | #135 | Exceptional 65.6% |
| Immigrants | Argentina | 92.4 /100 | #136 | Exceptional 65.6% |
| Guamanians/Chamorros | 92.4 /100 | #137 | Exceptional 65.6% |
| Immigrants | West Indies | 92.0 /100 | #138 | Exceptional 65.6% |
| Immigrants | Taiwan | 90.8 /100 | #139 | Exceptional 65.5% |
| Immigrants | Costa Rica | 90.8 /100 | #140 | Exceptional 65.5% |
| Samoans | 90.5 /100 | #141 | Exceptional 65.5% |
| Indians (Asian) | 89.5 /100 | #142 | Excellent 65.5% |
| Latvians | 89.4 /100 | #143 | Excellent 65.5% |
| Immigrants | Romania | 88.6 /100 | #144 | Excellent 65.5% |