Somali vs Peruvian In Labor Force | Age > 16
COMPARE
Somali
Peruvian
In Labor Force | Age > 16
In Labor Force | Age > 16 Comparison
Somalis
Peruvians
69.2%
IN LABOR FORCE | AGE > 16
100.0/ 100
METRIC RATING
3rd/ 347
METRIC RANK
66.3%
IN LABOR FORCE | AGE > 16
99.8/ 100
METRIC RATING
64th/ 347
METRIC RANK
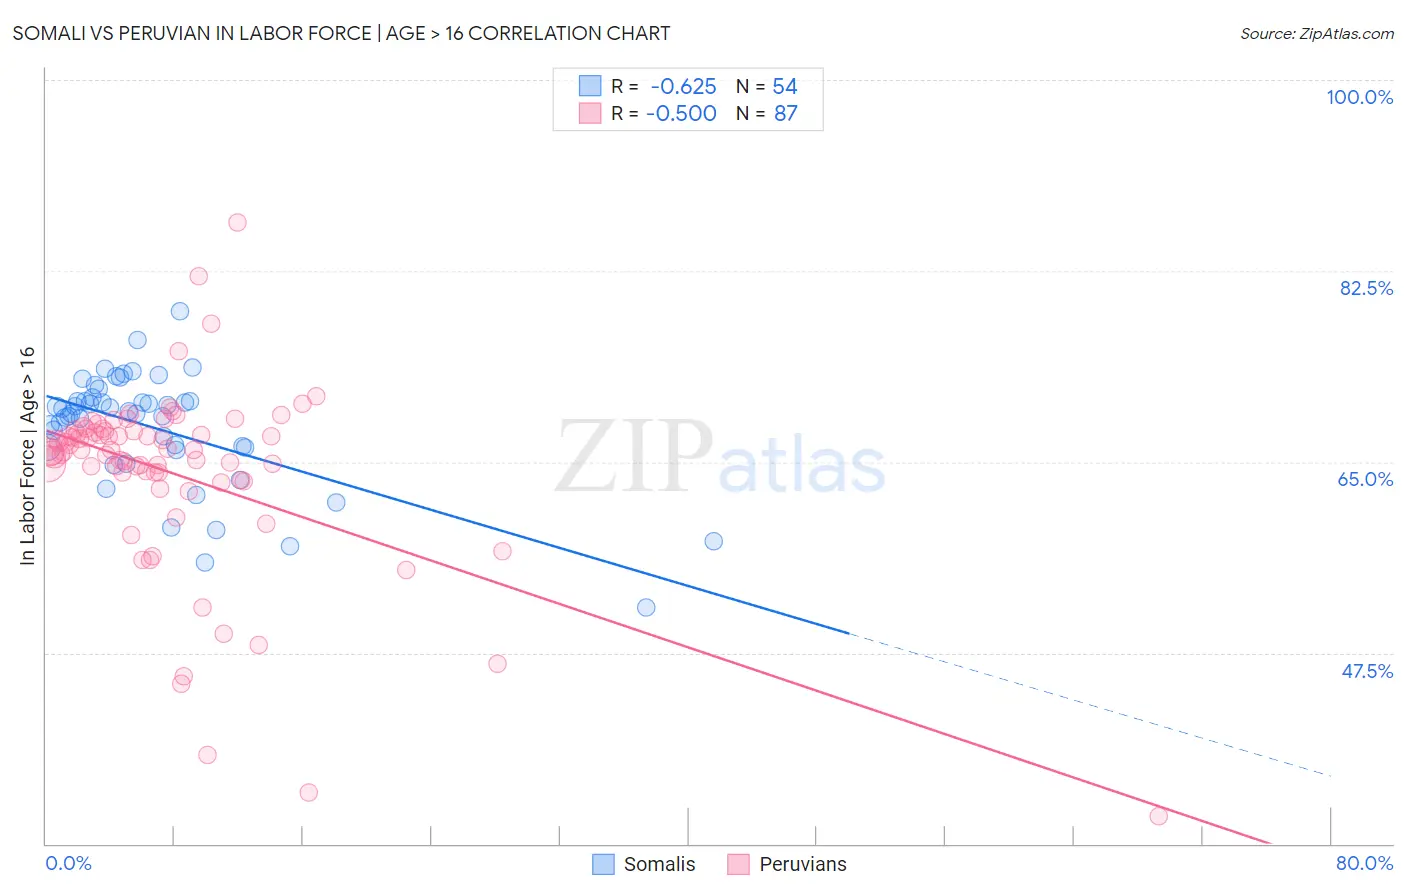
Somali vs Peruvian In Labor Force | Age > 16 Correlation Chart
The statistical analysis conducted on geographies consisting of 99,331,399 people shows a significant negative correlation between the proportion of Somalis and labor force participation rate among population ages 16 and over in the United States with a correlation coefficient (R) of -0.625 and weighted average of 69.2%. Similarly, the statistical analysis conducted on geographies consisting of 363,253,331 people shows a moderate negative correlation between the proportion of Peruvians and labor force participation rate among population ages 16 and over in the United States with a correlation coefficient (R) of -0.500 and weighted average of 66.3%, a difference of 4.3%.
In Labor Force | Age > 16 Correlation Summary
| Measurement | Somali | Peruvian |
| Minimum | 51.7% | 32.5% |
| Maximum | 78.8% | 86.9% |
| Range | 27.1% | 54.4% |
| Mean | 68.1% | 64.0% |
| Median | 69.5% | 66.1% |
| Interquartile 25% (IQ1) | 66.3% | 63.4% |
| Interquartile 75% (IQ3) | 70.6% | 67.8% |
| Interquartile Range (IQR) | 4.3% | 4.4% |
| Standard Deviation (Sample) | 5.3% | 8.6% |
| Standard Deviation (Population) | 5.2% | 8.6% |
Similar Demographics by In Labor Force | Age > 16
Demographics Similar to Somalis by In Labor Force | Age > 16
In terms of in labor force | age > 16, the demographic groups most similar to Somalis are Immigrants from Somalia (69.1%, a difference of 0.070%), Ethiopian (69.3%, a difference of 0.20%), Immigrants from Ethiopia (69.4%, a difference of 0.36%), Sierra Leonean (68.9%, a difference of 0.38%), and Immigrants from Eritrea (68.9%, a difference of 0.43%).
| Demographics | Rating | Rank | In Labor Force | Age > 16 |
| Immigrants | Ethiopia | 100.0 /100 | #1 | Exceptional 69.4% |
| Ethiopians | 100.0 /100 | #2 | Exceptional 69.3% |
| Somalis | 100.0 /100 | #3 | Exceptional 69.2% |
| Immigrants | Somalia | 100.0 /100 | #4 | Exceptional 69.1% |
| Sierra Leoneans | 100.0 /100 | #5 | Exceptional 68.9% |
| Immigrants | Eritrea | 100.0 /100 | #6 | Exceptional 68.9% |
| Immigrants | Cameroon | 100.0 /100 | #7 | Exceptional 68.7% |
| Immigrants | Sierra Leone | 100.0 /100 | #8 | Exceptional 68.5% |
| Immigrants | Eastern Africa | 100.0 /100 | #9 | Exceptional 68.5% |
| Immigrants | Bolivia | 100.0 /100 | #10 | Exceptional 68.4% |
| Bolivians | 100.0 /100 | #11 | Exceptional 68.2% |
| Sudanese | 100.0 /100 | #12 | Exceptional 68.0% |
| Immigrants | Nepal | 100.0 /100 | #13 | Exceptional 68.0% |
| Liberians | 100.0 /100 | #14 | Exceptional 67.8% |
| Immigrants | Middle Africa | 100.0 /100 | #15 | Exceptional 67.7% |
Demographics Similar to Peruvians by In Labor Force | Age > 16
In terms of in labor force | age > 16, the demographic groups most similar to Peruvians are Venezuelan (66.3%, a difference of 0.0%), Sri Lankan (66.3%, a difference of 0.010%), Jordanian (66.3%, a difference of 0.030%), Immigrants from Peru (66.3%, a difference of 0.040%), and Immigrants from Burma/Myanmar (66.3%, a difference of 0.040%).
| Demographics | Rating | Rank | In Labor Force | Age > 16 |
| Bulgarians | 99.9 /100 | #57 | Exceptional 66.4% |
| Immigrants | Saudi Arabia | 99.9 /100 | #58 | Exceptional 66.3% |
| Immigrants | Turkey | 99.9 /100 | #59 | Exceptional 66.3% |
| Immigrants | Peru | 99.8 /100 | #60 | Exceptional 66.3% |
| Immigrants | Burma/Myanmar | 99.8 /100 | #61 | Exceptional 66.3% |
| Indonesians | 99.8 /100 | #62 | Exceptional 66.3% |
| Venezuelans | 99.8 /100 | #63 | Exceptional 66.3% |
| Peruvians | 99.8 /100 | #64 | Exceptional 66.3% |
| Sri Lankans | 99.8 /100 | #65 | Exceptional 66.3% |
| Jordanians | 99.8 /100 | #66 | Exceptional 66.3% |
| Egyptians | 99.8 /100 | #67 | Exceptional 66.2% |
| Immigrants | Egypt | 99.7 /100 | #68 | Exceptional 66.2% |
| Sub-Saharan Africans | 99.7 /100 | #69 | Exceptional 66.2% |
| Asians | 99.7 /100 | #70 | Exceptional 66.2% |
| Burmese | 99.7 /100 | #71 | Exceptional 66.2% |