Hungarian vs Guamanian/Chamorro In Labor Force | Age > 16
COMPARE
Hungarian
Guamanian/Chamorro
In Labor Force | Age > 16
In Labor Force | Age > 16 Comparison
Hungarians
Guamanians/Chamorros
63.8%
IN LABOR FORCE | AGE > 16
0.1/ 100
METRIC RATING
290th/ 347
METRIC RANK
65.6%
IN LABOR FORCE | AGE > 16
92.4/ 100
METRIC RATING
137th/ 347
METRIC RANK
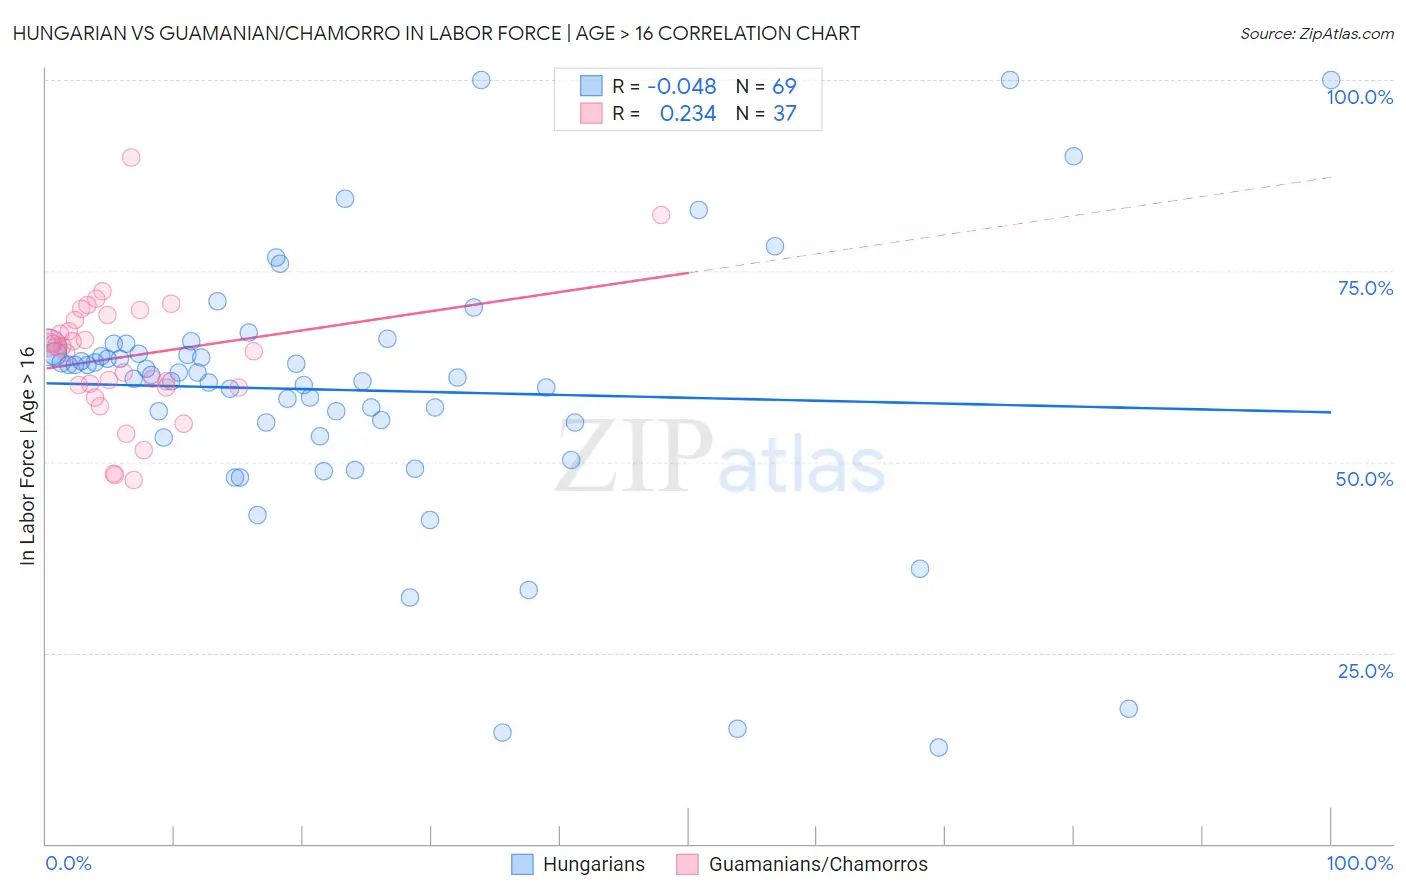
Hungarian vs Guamanian/Chamorro In Labor Force | Age > 16 Correlation Chart
The statistical analysis conducted on geographies consisting of 486,247,261 people shows no correlation between the proportion of Hungarians and labor force participation rate among population ages 16 and over in the United States with a correlation coefficient (R) of -0.048 and weighted average of 63.8%. Similarly, the statistical analysis conducted on geographies consisting of 221,958,282 people shows a weak positive correlation between the proportion of Guamanians/Chamorros and labor force participation rate among population ages 16 and over in the United States with a correlation coefficient (R) of 0.234 and weighted average of 65.6%, a difference of 2.8%.
In Labor Force | Age > 16 Correlation Summary
| Measurement | Hungarian | Guamanian/Chamorro |
| Minimum | 12.6% | 47.6% |
| Maximum | 100.0% | 89.8% |
| Range | 87.4% | 42.2% |
| Mean | 59.4% | 63.8% |
| Median | 61.3% | 65.1% |
| Interquartile 25% (IQ1) | 54.3% | 59.8% |
| Interquartile 75% (IQ3) | 64.6% | 68.9% |
| Interquartile Range (IQR) | 10.3% | 9.2% |
| Standard Deviation (Sample) | 17.2% | 8.6% |
| Standard Deviation (Population) | 17.0% | 8.5% |
Similar Demographics by In Labor Force | Age > 16
Demographics Similar to Hungarians by In Labor Force | Age > 16
In terms of in labor force | age > 16, the demographic groups most similar to Hungarians are Nepalese (63.8%, a difference of 0.010%), Celtic (63.8%, a difference of 0.030%), Spanish (63.9%, a difference of 0.060%), Spanish American Indian (63.8%, a difference of 0.070%), and Immigrants from Austria (63.9%, a difference of 0.10%).
| Demographics | Rating | Rank | In Labor Force | Age > 16 |
| Immigrants | Germany | 0.1 /100 | #283 | Tragic 63.9% |
| French | 0.1 /100 | #284 | Tragic 63.9% |
| Slovaks | 0.1 /100 | #285 | Tragic 63.9% |
| Immigrants | Austria | 0.1 /100 | #286 | Tragic 63.9% |
| Scottish | 0.1 /100 | #287 | Tragic 63.9% |
| Spanish | 0.1 /100 | #288 | Tragic 63.9% |
| Celtics | 0.1 /100 | #289 | Tragic 63.8% |
| Hungarians | 0.1 /100 | #290 | Tragic 63.8% |
| Nepalese | 0.1 /100 | #291 | Tragic 63.8% |
| Spanish American Indians | 0.1 /100 | #292 | Tragic 63.8% |
| English | 0.1 /100 | #293 | Tragic 63.7% |
| Puget Sound Salish | 0.0 /100 | #294 | Tragic 63.7% |
| Immigrants | Canada | 0.0 /100 | #295 | Tragic 63.7% |
| Immigrants | North America | 0.0 /100 | #296 | Tragic 63.7% |
| Immigrants | Grenada | 0.0 /100 | #297 | Tragic 63.6% |
Demographics Similar to Guamanians/Chamorros by In Labor Force | Age > 16
In terms of in labor force | age > 16, the demographic groups most similar to Guamanians/Chamorros are Guatemalan (65.6%, a difference of 0.0%), Immigrants from Argentina (65.6%, a difference of 0.0%), Immigrants from West Indies (65.6%, a difference of 0.010%), Costa Rican (65.6%, a difference of 0.040%), and Immigrants from Lithuania (65.6%, a difference of 0.050%).
| Demographics | Rating | Rank | In Labor Force | Age > 16 |
| Immigrants | Guatemala | 94.4 /100 | #130 | Exceptional 65.6% |
| Icelanders | 94.3 /100 | #131 | Exceptional 65.6% |
| Immigrants | North Macedonia | 94.1 /100 | #132 | Exceptional 65.6% |
| Immigrants | Lithuania | 93.5 /100 | #133 | Exceptional 65.6% |
| Costa Ricans | 93.2 /100 | #134 | Exceptional 65.6% |
| Guatemalans | 92.5 /100 | #135 | Exceptional 65.6% |
| Immigrants | Argentina | 92.4 /100 | #136 | Exceptional 65.6% |
| Guamanians/Chamorros | 92.4 /100 | #137 | Exceptional 65.6% |
| Immigrants | West Indies | 92.0 /100 | #138 | Exceptional 65.6% |
| Immigrants | Taiwan | 90.8 /100 | #139 | Exceptional 65.5% |
| Immigrants | Costa Rica | 90.8 /100 | #140 | Exceptional 65.5% |
| Samoans | 90.5 /100 | #141 | Exceptional 65.5% |
| Indians (Asian) | 89.5 /100 | #142 | Excellent 65.5% |
| Latvians | 89.4 /100 | #143 | Excellent 65.5% |
| Immigrants | Romania | 88.6 /100 | #144 | Excellent 65.5% |