Immigrants from Panama vs Guamanian/Chamorro In Labor Force | Age > 16
COMPARE
Immigrants from Panama
Guamanian/Chamorro
In Labor Force | Age > 16
In Labor Force | Age > 16 Comparison
Immigrants from Panama
Guamanians/Chamorros
65.1%
IN LABOR FORCE | AGE > 16
42.4/ 100
METRIC RATING
181st/ 347
METRIC RANK
65.6%
IN LABOR FORCE | AGE > 16
92.4/ 100
METRIC RATING
137th/ 347
METRIC RANK
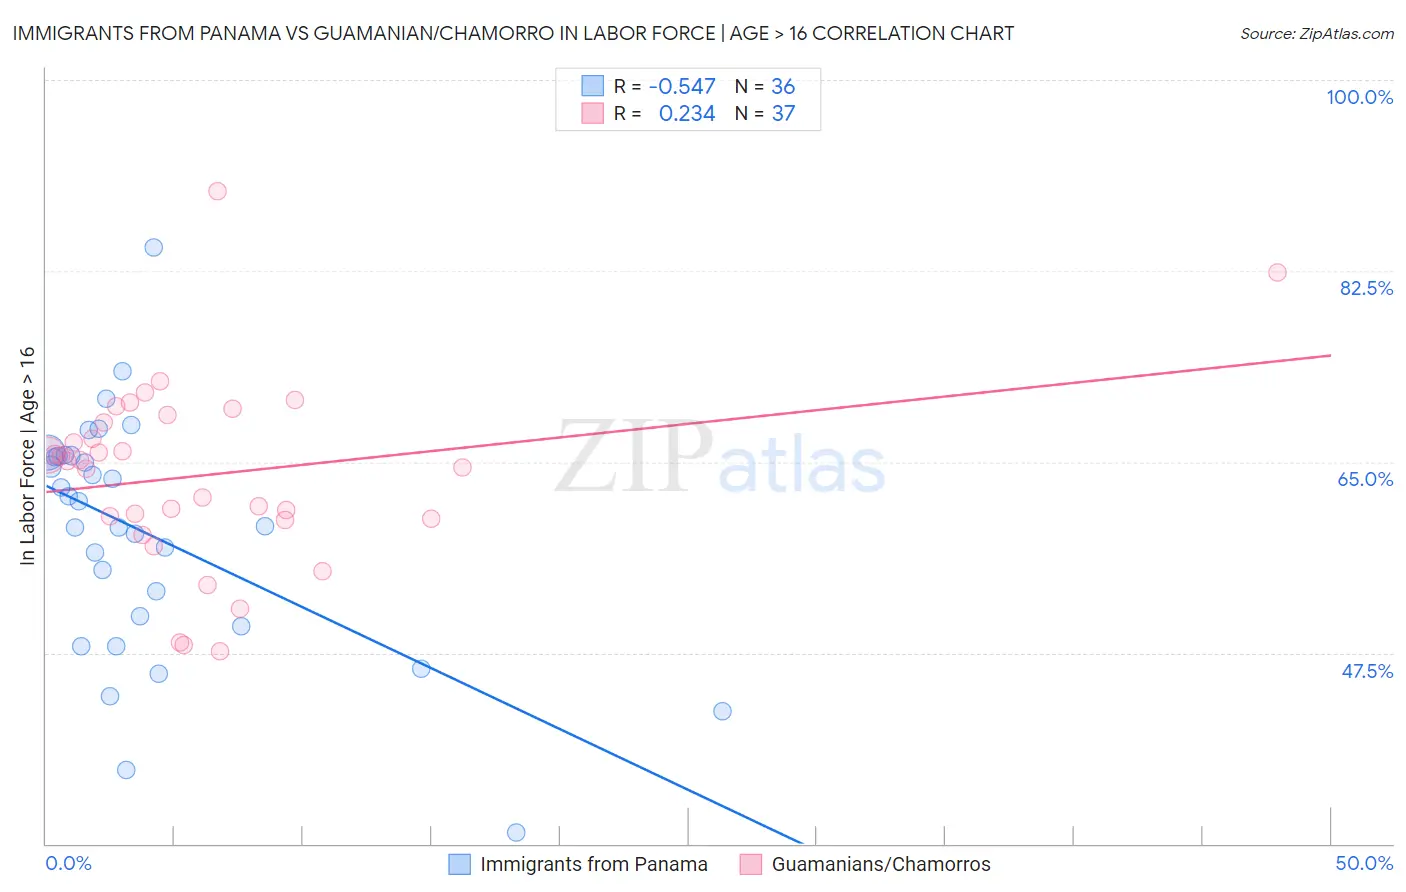
Immigrants from Panama vs Guamanian/Chamorro In Labor Force | Age > 16 Correlation Chart
The statistical analysis conducted on geographies consisting of 221,185,422 people shows a substantial negative correlation between the proportion of Immigrants from Panama and labor force participation rate among population ages 16 and over in the United States with a correlation coefficient (R) of -0.547 and weighted average of 65.1%. Similarly, the statistical analysis conducted on geographies consisting of 221,958,282 people shows a weak positive correlation between the proportion of Guamanians/Chamorros and labor force participation rate among population ages 16 and over in the United States with a correlation coefficient (R) of 0.234 and weighted average of 65.6%, a difference of 0.79%.
In Labor Force | Age > 16 Correlation Summary
| Measurement | Immigrants from Panama | Guamanian/Chamorro |
| Minimum | 31.0% | 47.6% |
| Maximum | 84.7% | 89.8% |
| Range | 53.7% | 42.2% |
| Mean | 58.4% | 63.8% |
| Median | 60.3% | 65.1% |
| Interquartile 25% (IQ1) | 50.4% | 59.8% |
| Interquartile 75% (IQ3) | 65.5% | 68.9% |
| Interquartile Range (IQR) | 15.1% | 9.2% |
| Standard Deviation (Sample) | 10.9% | 8.6% |
| Standard Deviation (Population) | 10.8% | 8.5% |
Similar Demographics by In Labor Force | Age > 16
Demographics Similar to Immigrants from Panama by In Labor Force | Age > 16
In terms of in labor force | age > 16, the demographic groups most similar to Immigrants from Panama are Immigrants from Haiti (65.1%, a difference of 0.010%), Immigrants from Latvia (65.1%, a difference of 0.010%), Immigrants from Nicaragua (65.1%, a difference of 0.020%), Soviet Union (65.0%, a difference of 0.020%), and Trinidadian and Tobagonian (65.1%, a difference of 0.030%).
| Demographics | Rating | Rank | In Labor Force | Age > 16 |
| Macedonians | 50.0 /100 | #174 | Average 65.1% |
| Nicaraguans | 49.7 /100 | #175 | Average 65.1% |
| Swedes | 47.4 /100 | #176 | Average 65.1% |
| Eastern Europeans | 46.2 /100 | #177 | Average 65.1% |
| Trinidadians and Tobagonians | 45.2 /100 | #178 | Average 65.1% |
| Immigrants | Haiti | 43.3 /100 | #179 | Average 65.1% |
| Immigrants | Latvia | 42.9 /100 | #180 | Average 65.1% |
| Immigrants | Panama | 42.4 /100 | #181 | Average 65.1% |
| Immigrants | Nicaragua | 41.1 /100 | #182 | Average 65.1% |
| Soviet Union | 40.5 /100 | #183 | Average 65.0% |
| Carpatho Rusyns | 40.0 /100 | #184 | Average 65.0% |
| Syrians | 40.0 /100 | #185 | Average 65.0% |
| Immigrants | Switzerland | 38.2 /100 | #186 | Fair 65.0% |
| Immigrants | Croatia | 35.7 /100 | #187 | Fair 65.0% |
| Immigrants | Portugal | 34.8 /100 | #188 | Fair 65.0% |
Demographics Similar to Guamanians/Chamorros by In Labor Force | Age > 16
In terms of in labor force | age > 16, the demographic groups most similar to Guamanians/Chamorros are Guatemalan (65.6%, a difference of 0.0%), Immigrants from Argentina (65.6%, a difference of 0.0%), Immigrants from West Indies (65.6%, a difference of 0.010%), Costa Rican (65.6%, a difference of 0.040%), and Immigrants from Lithuania (65.6%, a difference of 0.050%).
| Demographics | Rating | Rank | In Labor Force | Age > 16 |
| Immigrants | Guatemala | 94.4 /100 | #130 | Exceptional 65.6% |
| Icelanders | 94.3 /100 | #131 | Exceptional 65.6% |
| Immigrants | North Macedonia | 94.1 /100 | #132 | Exceptional 65.6% |
| Immigrants | Lithuania | 93.5 /100 | #133 | Exceptional 65.6% |
| Costa Ricans | 93.2 /100 | #134 | Exceptional 65.6% |
| Guatemalans | 92.5 /100 | #135 | Exceptional 65.6% |
| Immigrants | Argentina | 92.4 /100 | #136 | Exceptional 65.6% |
| Guamanians/Chamorros | 92.4 /100 | #137 | Exceptional 65.6% |
| Immigrants | West Indies | 92.0 /100 | #138 | Exceptional 65.6% |
| Immigrants | Taiwan | 90.8 /100 | #139 | Exceptional 65.5% |
| Immigrants | Costa Rica | 90.8 /100 | #140 | Exceptional 65.5% |
| Samoans | 90.5 /100 | #141 | Exceptional 65.5% |
| Indians (Asian) | 89.5 /100 | #142 | Excellent 65.5% |
| Latvians | 89.4 /100 | #143 | Excellent 65.5% |
| Immigrants | Romania | 88.6 /100 | #144 | Excellent 65.5% |