Crow vs Guamanian/Chamorro In Labor Force | Age > 16
COMPARE
Crow
Guamanian/Chamorro
In Labor Force | Age > 16
In Labor Force | Age > 16 Comparison
Crow
Guamanians/Chamorros
60.8%
IN LABOR FORCE | AGE > 16
0.0/ 100
METRIC RATING
332nd/ 347
METRIC RANK
65.6%
IN LABOR FORCE | AGE > 16
92.4/ 100
METRIC RATING
137th/ 347
METRIC RANK
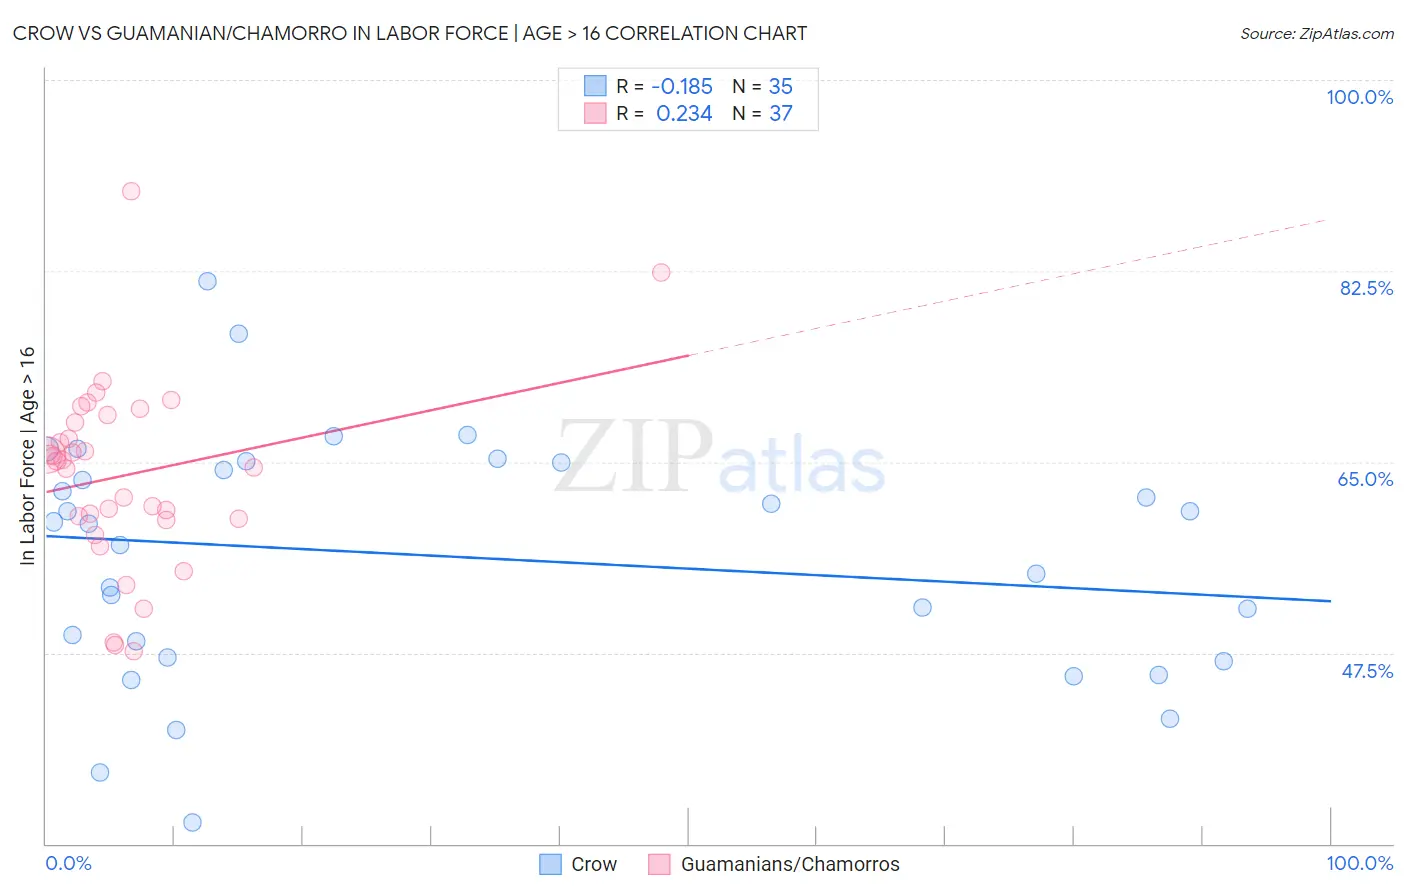
Crow vs Guamanian/Chamorro In Labor Force | Age > 16 Correlation Chart
The statistical analysis conducted on geographies consisting of 59,204,758 people shows a poor negative correlation between the proportion of Crow and labor force participation rate among population ages 16 and over in the United States with a correlation coefficient (R) of -0.185 and weighted average of 60.8%. Similarly, the statistical analysis conducted on geographies consisting of 221,958,282 people shows a weak positive correlation between the proportion of Guamanians/Chamorros and labor force participation rate among population ages 16 and over in the United States with a correlation coefficient (R) of 0.234 and weighted average of 65.6%, a difference of 7.9%.
In Labor Force | Age > 16 Correlation Summary
| Measurement | Crow | Guamanian/Chamorro |
| Minimum | 31.9% | 47.6% |
| Maximum | 81.6% | 89.8% |
| Range | 49.7% | 42.2% |
| Mean | 56.4% | 63.8% |
| Median | 59.4% | 65.1% |
| Interquartile 25% (IQ1) | 47.1% | 59.8% |
| Interquartile 75% (IQ3) | 65.0% | 68.9% |
| Interquartile Range (IQR) | 17.9% | 9.2% |
| Standard Deviation (Sample) | 11.1% | 8.6% |
| Standard Deviation (Population) | 10.9% | 8.5% |
Similar Demographics by In Labor Force | Age > 16
Demographics Similar to Crow by In Labor Force | Age > 16
In terms of in labor force | age > 16, the demographic groups most similar to Crow are Paiute (60.7%, a difference of 0.080%), Apache (60.7%, a difference of 0.13%), Ute (60.9%, a difference of 0.17%), Native/Alaskan (60.6%, a difference of 0.31%), and Menominee (60.6%, a difference of 0.34%).
| Demographics | Rating | Rank | In Labor Force | Age > 16 |
| Cherokee | 0.0 /100 | #325 | Tragic 61.9% |
| Sioux | 0.0 /100 | #326 | Tragic 61.8% |
| Cajuns | 0.0 /100 | #327 | Tragic 61.8% |
| Dutch West Indians | 0.0 /100 | #328 | Tragic 61.7% |
| Choctaw | 0.0 /100 | #329 | Tragic 61.5% |
| Creek | 0.0 /100 | #330 | Tragic 61.3% |
| Ute | 0.0 /100 | #331 | Tragic 60.9% |
| Crow | 0.0 /100 | #332 | Tragic 60.8% |
| Paiute | 0.0 /100 | #333 | Tragic 60.7% |
| Apache | 0.0 /100 | #334 | Tragic 60.7% |
| Natives/Alaskans | 0.0 /100 | #335 | Tragic 60.6% |
| Menominee | 0.0 /100 | #336 | Tragic 60.6% |
| Colville | 0.0 /100 | #337 | Tragic 59.8% |
| Immigrants | Yemen | 0.0 /100 | #338 | Tragic 59.6% |
| Houma | 0.0 /100 | #339 | Tragic 59.5% |
Demographics Similar to Guamanians/Chamorros by In Labor Force | Age > 16
In terms of in labor force | age > 16, the demographic groups most similar to Guamanians/Chamorros are Guatemalan (65.6%, a difference of 0.0%), Immigrants from Argentina (65.6%, a difference of 0.0%), Immigrants from West Indies (65.6%, a difference of 0.010%), Costa Rican (65.6%, a difference of 0.040%), and Immigrants from Lithuania (65.6%, a difference of 0.050%).
| Demographics | Rating | Rank | In Labor Force | Age > 16 |
| Immigrants | Guatemala | 94.4 /100 | #130 | Exceptional 65.6% |
| Icelanders | 94.3 /100 | #131 | Exceptional 65.6% |
| Immigrants | North Macedonia | 94.1 /100 | #132 | Exceptional 65.6% |
| Immigrants | Lithuania | 93.5 /100 | #133 | Exceptional 65.6% |
| Costa Ricans | 93.2 /100 | #134 | Exceptional 65.6% |
| Guatemalans | 92.5 /100 | #135 | Exceptional 65.6% |
| Immigrants | Argentina | 92.4 /100 | #136 | Exceptional 65.6% |
| Guamanians/Chamorros | 92.4 /100 | #137 | Exceptional 65.6% |
| Immigrants | West Indies | 92.0 /100 | #138 | Exceptional 65.6% |
| Immigrants | Taiwan | 90.8 /100 | #139 | Exceptional 65.5% |
| Immigrants | Costa Rica | 90.8 /100 | #140 | Exceptional 65.5% |
| Samoans | 90.5 /100 | #141 | Exceptional 65.5% |
| Indians (Asian) | 89.5 /100 | #142 | Excellent 65.5% |
| Latvians | 89.4 /100 | #143 | Excellent 65.5% |
| Immigrants | Romania | 88.6 /100 | #144 | Excellent 65.5% |