Kiowa vs Guamanian/Chamorro In Labor Force | Age 16-19
COMPARE
Kiowa
Guamanian/Chamorro
In Labor Force | Age 16-19
In Labor Force | Age 16-19 Comparison
Kiowa
Guamanians/Chamorros
37.2%
IN LABOR FORCE | AGE 16-19
80.4/ 100
METRIC RATING
156th/ 347
METRIC RANK
38.2%
IN LABOR FORCE | AGE 16-19
97.4/ 100
METRIC RATING
122nd/ 347
METRIC RANK
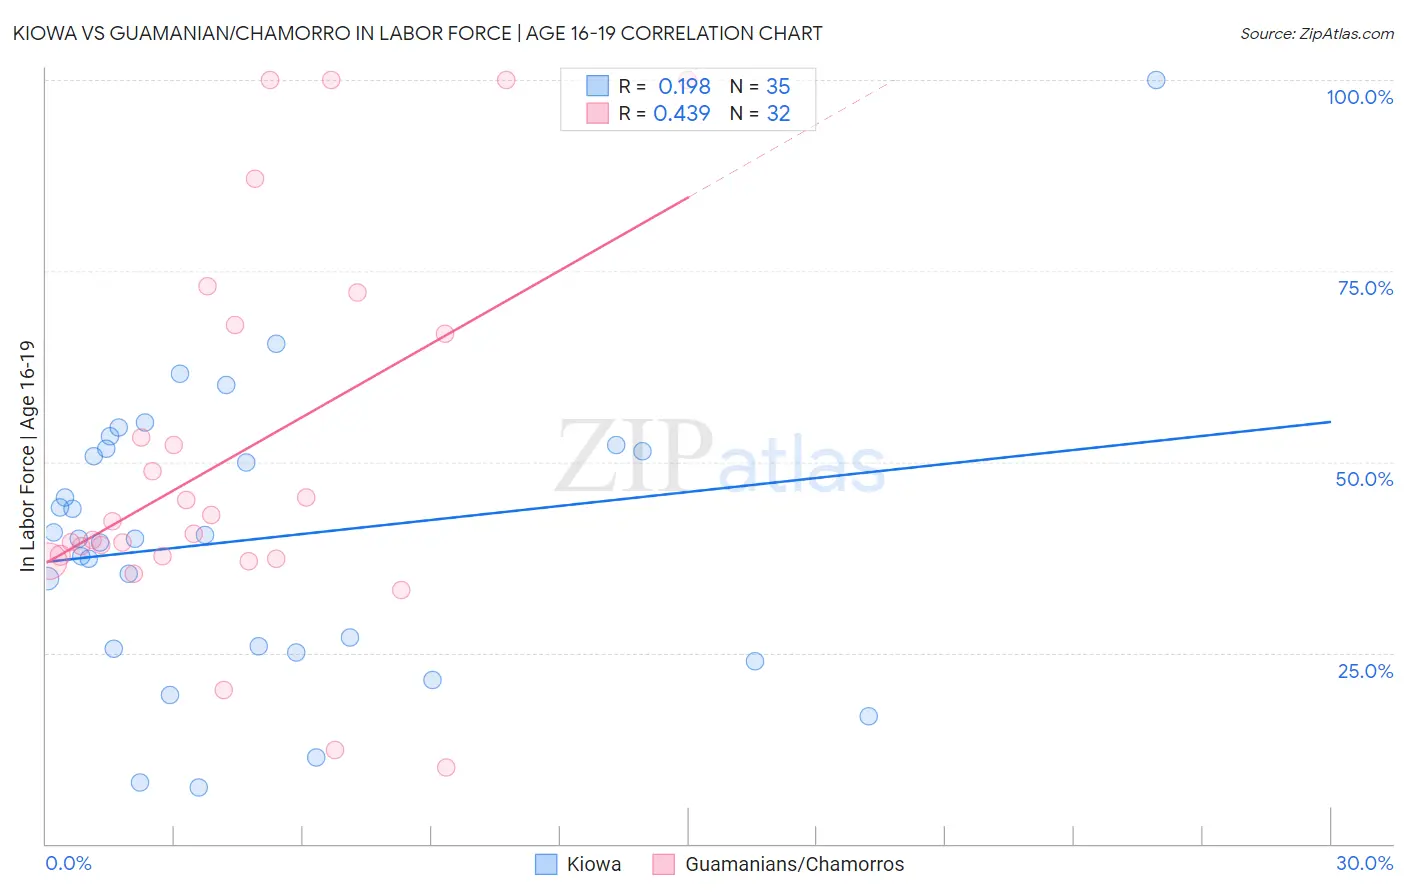
Kiowa vs Guamanian/Chamorro In Labor Force | Age 16-19 Correlation Chart
The statistical analysis conducted on geographies consisting of 56,077,832 people shows a poor positive correlation between the proportion of Kiowa and labor force participation rate among population between the ages 16 and 19 in the United States with a correlation coefficient (R) of 0.198 and weighted average of 37.2%. Similarly, the statistical analysis conducted on geographies consisting of 221,811,723 people shows a moderate positive correlation between the proportion of Guamanians/Chamorros and labor force participation rate among population between the ages 16 and 19 in the United States with a correlation coefficient (R) of 0.439 and weighted average of 38.2%, a difference of 2.7%.
In Labor Force | Age 16-19 Correlation Summary
| Measurement | Kiowa | Guamanian/Chamorro |
| Minimum | 7.4% | 10.0% |
| Maximum | 100.0% | 100.0% |
| Range | 92.6% | 90.0% |
| Mean | 39.9% | 51.0% |
| Median | 40.0% | 41.4% |
| Interquartile 25% (IQ1) | 25.5% | 37.5% |
| Interquartile 75% (IQ3) | 51.7% | 67.3% |
| Interquartile Range (IQR) | 26.2% | 29.8% |
| Standard Deviation (Sample) | 18.6% | 24.8% |
| Standard Deviation (Population) | 18.3% | 24.4% |
Similar Demographics by In Labor Force | Age 16-19
Demographics Similar to Kiowa by In Labor Force | Age 16-19
In terms of in labor force | age 16-19, the demographic groups most similar to Kiowa are Immigrants from Lithuania (37.2%, a difference of 0.020%), Immigrants from Bulgaria (37.3%, a difference of 0.10%), Arapaho (37.3%, a difference of 0.12%), Immigrants from Sierra Leone (37.3%, a difference of 0.27%), and Immigrants from Brazil (37.1%, a difference of 0.29%).
| Demographics | Rating | Rank | In Labor Force | Age 16-19 |
| Native Hawaiians | 85.0 /100 | #149 | Excellent 37.4% |
| Tsimshian | 84.7 /100 | #150 | Excellent 37.4% |
| Immigrants | Poland | 84.4 /100 | #151 | Excellent 37.3% |
| Immigrants | Sierra Leone | 83.6 /100 | #152 | Excellent 37.3% |
| Arapaho | 81.8 /100 | #153 | Excellent 37.3% |
| Immigrants | Bulgaria | 81.6 /100 | #154 | Excellent 37.3% |
| Immigrants | Lithuania | 80.7 /100 | #155 | Excellent 37.2% |
| Kiowa | 80.4 /100 | #156 | Excellent 37.2% |
| Immigrants | Brazil | 76.5 /100 | #157 | Good 37.1% |
| Ute | 75.7 /100 | #158 | Good 37.1% |
| Yaqui | 74.4 /100 | #159 | Good 37.1% |
| Immigrants | Saudi Arabia | 73.9 /100 | #160 | Good 37.0% |
| Cambodians | 71.5 /100 | #161 | Good 37.0% |
| Immigrants | Jordan | 69.5 /100 | #162 | Good 36.9% |
| Bermudans | 69.3 /100 | #163 | Good 36.9% |
Demographics Similar to Guamanians/Chamorros by In Labor Force | Age 16-19
In terms of in labor force | age 16-19, the demographic groups most similar to Guamanians/Chamorros are Ethiopian (38.2%, a difference of 0.030%), Ukrainian (38.3%, a difference of 0.13%), Assyrian/Chaldean/Syriac (38.3%, a difference of 0.22%), Immigrants from Nepal (38.3%, a difference of 0.23%), and Chickasaw (38.3%, a difference of 0.25%).
| Demographics | Rating | Rank | In Labor Force | Age 16-19 |
| Bulgarians | 97.9 /100 | #115 | Exceptional 38.3% |
| Colville | 97.9 /100 | #116 | Exceptional 38.3% |
| Chickasaw | 97.8 /100 | #117 | Exceptional 38.3% |
| Immigrants | Nepal | 97.8 /100 | #118 | Exceptional 38.3% |
| Assyrians/Chaldeans/Syriacs | 97.8 /100 | #119 | Exceptional 38.3% |
| Ukrainians | 97.6 /100 | #120 | Exceptional 38.3% |
| Ethiopians | 97.4 /100 | #121 | Exceptional 38.2% |
| Guamanians/Chamorros | 97.4 /100 | #122 | Exceptional 38.2% |
| Seminole | 96.7 /100 | #123 | Exceptional 38.1% |
| Immigrants | England | 96.4 /100 | #124 | Exceptional 38.1% |
| Immigrants | Africa | 96.1 /100 | #125 | Exceptional 38.0% |
| Africans | 95.6 /100 | #126 | Exceptional 38.0% |
| Choctaw | 95.6 /100 | #127 | Exceptional 38.0% |
| New Zealanders | 95.6 /100 | #128 | Exceptional 38.0% |
| Spaniards | 95.5 /100 | #129 | Exceptional 38.0% |