Immigrants from Argentina vs Guamanian/Chamorro In Labor Force | Age 16-19
COMPARE
Immigrants from Argentina
Guamanian/Chamorro
In Labor Force | Age 16-19
In Labor Force | Age 16-19 Comparison
Immigrants from Argentina
Guamanians/Chamorros
32.9%
IN LABOR FORCE | AGE 16-19
0.0/ 100
METRIC RATING
300th/ 347
METRIC RANK
38.2%
IN LABOR FORCE | AGE 16-19
97.4/ 100
METRIC RATING
122nd/ 347
METRIC RANK
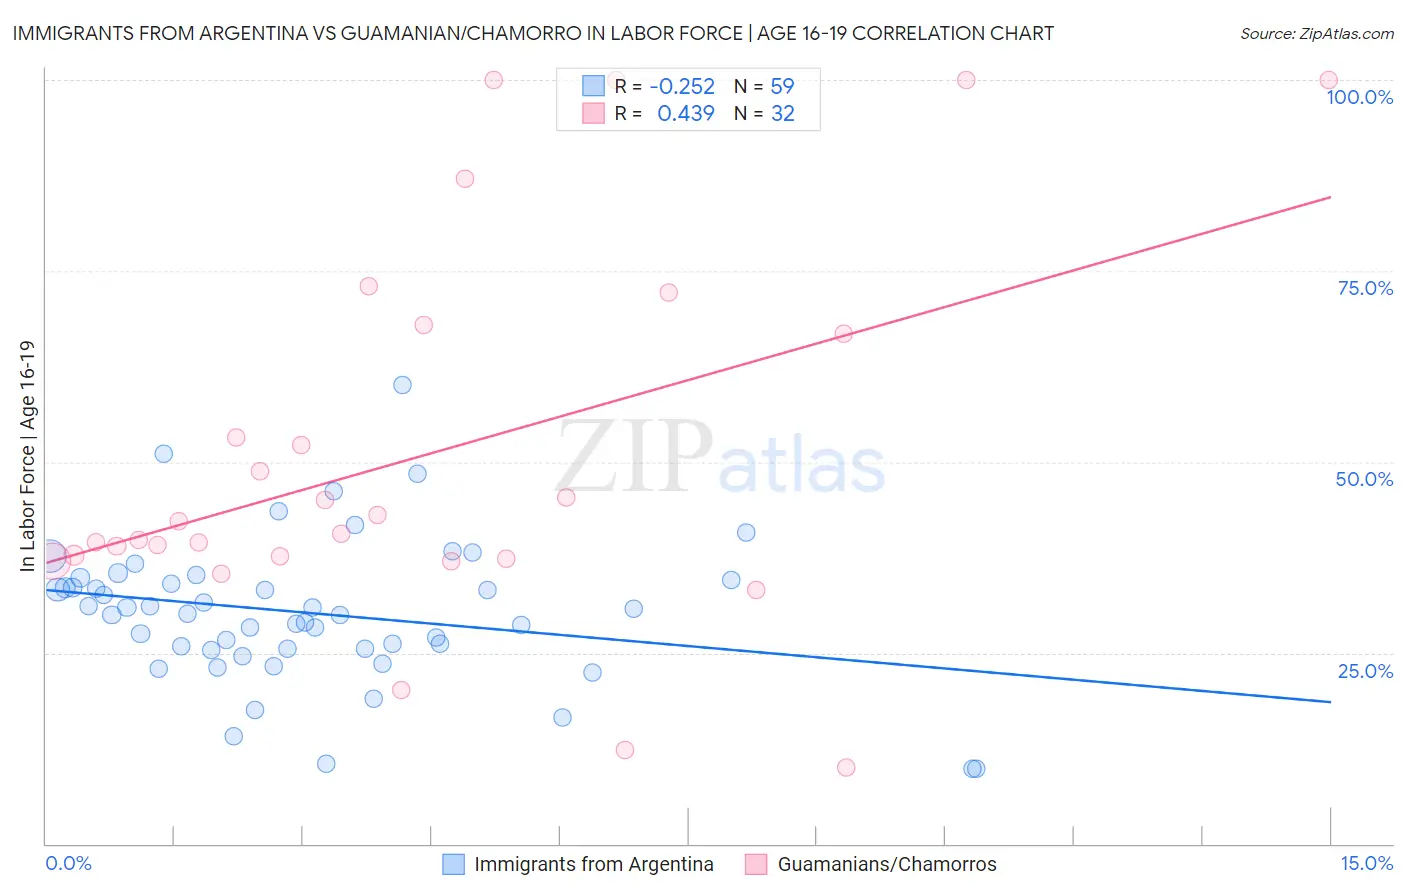
Immigrants from Argentina vs Guamanian/Chamorro In Labor Force | Age 16-19 Correlation Chart
The statistical analysis conducted on geographies consisting of 264,171,255 people shows a weak negative correlation between the proportion of Immigrants from Argentina and labor force participation rate among population between the ages 16 and 19 in the United States with a correlation coefficient (R) of -0.252 and weighted average of 32.9%. Similarly, the statistical analysis conducted on geographies consisting of 221,811,723 people shows a moderate positive correlation between the proportion of Guamanians/Chamorros and labor force participation rate among population between the ages 16 and 19 in the United States with a correlation coefficient (R) of 0.439 and weighted average of 38.2%, a difference of 16.3%.
In Labor Force | Age 16-19 Correlation Summary
| Measurement | Immigrants from Argentina | Guamanian/Chamorro |
| Minimum | 9.8% | 10.0% |
| Maximum | 60.0% | 100.0% |
| Range | 50.2% | 90.0% |
| Mean | 30.2% | 51.0% |
| Median | 30.2% | 41.4% |
| Interquartile 25% (IQ1) | 25.5% | 37.5% |
| Interquartile 75% (IQ3) | 34.5% | 67.3% |
| Interquartile Range (IQR) | 9.0% | 29.8% |
| Standard Deviation (Sample) | 9.4% | 24.8% |
| Standard Deviation (Population) | 9.3% | 24.4% |
Similar Demographics by In Labor Force | Age 16-19
Demographics Similar to Immigrants from Argentina by In Labor Force | Age 16-19
In terms of in labor force | age 16-19, the demographic groups most similar to Immigrants from Argentina are Armenian (32.9%, a difference of 0.15%), Okinawan (32.8%, a difference of 0.24%), Belizean (32.8%, a difference of 0.38%), Iranian (33.0%, a difference of 0.40%), and Immigrants from Haiti (33.2%, a difference of 0.91%).
| Demographics | Rating | Rank | In Labor Force | Age 16-19 |
| Immigrants | South America | 0.1 /100 | #293 | Tragic 33.3% |
| Argentineans | 0.1 /100 | #294 | Tragic 33.3% |
| Yup'ik | 0.1 /100 | #295 | Tragic 33.3% |
| Jamaicans | 0.1 /100 | #296 | Tragic 33.2% |
| Immigrants | Haiti | 0.1 /100 | #297 | Tragic 33.2% |
| Iranians | 0.0 /100 | #298 | Tragic 33.0% |
| Armenians | 0.0 /100 | #299 | Tragic 32.9% |
| Immigrants | Argentina | 0.0 /100 | #300 | Tragic 32.9% |
| Okinawans | 0.0 /100 | #301 | Tragic 32.8% |
| Belizeans | 0.0 /100 | #302 | Tragic 32.8% |
| Immigrants | Dominica | 0.0 /100 | #303 | Tragic 32.5% |
| Israelis | 0.0 /100 | #304 | Tragic 32.4% |
| Nicaraguans | 0.0 /100 | #305 | Tragic 32.4% |
| Spanish American Indians | 0.0 /100 | #306 | Tragic 32.4% |
| Immigrants | Jamaica | 0.0 /100 | #307 | Tragic 32.2% |
Demographics Similar to Guamanians/Chamorros by In Labor Force | Age 16-19
In terms of in labor force | age 16-19, the demographic groups most similar to Guamanians/Chamorros are Ethiopian (38.2%, a difference of 0.030%), Ukrainian (38.3%, a difference of 0.13%), Assyrian/Chaldean/Syriac (38.3%, a difference of 0.22%), Immigrants from Nepal (38.3%, a difference of 0.23%), and Chickasaw (38.3%, a difference of 0.25%).
| Demographics | Rating | Rank | In Labor Force | Age 16-19 |
| Bulgarians | 97.9 /100 | #115 | Exceptional 38.3% |
| Colville | 97.9 /100 | #116 | Exceptional 38.3% |
| Chickasaw | 97.8 /100 | #117 | Exceptional 38.3% |
| Immigrants | Nepal | 97.8 /100 | #118 | Exceptional 38.3% |
| Assyrians/Chaldeans/Syriacs | 97.8 /100 | #119 | Exceptional 38.3% |
| Ukrainians | 97.6 /100 | #120 | Exceptional 38.3% |
| Ethiopians | 97.4 /100 | #121 | Exceptional 38.2% |
| Guamanians/Chamorros | 97.4 /100 | #122 | Exceptional 38.2% |
| Seminole | 96.7 /100 | #123 | Exceptional 38.1% |
| Immigrants | England | 96.4 /100 | #124 | Exceptional 38.1% |
| Immigrants | Africa | 96.1 /100 | #125 | Exceptional 38.0% |
| Africans | 95.6 /100 | #126 | Exceptional 38.0% |
| Choctaw | 95.6 /100 | #127 | Exceptional 38.0% |
| New Zealanders | 95.6 /100 | #128 | Exceptional 38.0% |
| Spaniards | 95.5 /100 | #129 | Exceptional 38.0% |